It is always difficult when you have sets of different overlapping rasters to visualize properly. Rasters are usualy a full coverage and so two rasters(or more) on top of each other block the view on one of them. As historically ILWIS is oriented towards rasters I felt I had to offer more flexibility when displaying rasters. So what options do we have? Well basically three
- Transparency. Make one layer (partially) transparent so you can view the “lower” layer
- 3D Orientation. seperate the two layers in 3D space and view them there
- Time shift. Quickly blink between layers to inspect different layers
So lets explore these options!
Transparency and visibility
ILWIS 3.8 has fairly extensive transparency facilities. There is of course the “normal” full layer transparency. This applies transparency to each and every pixel in the map. It is fine but it has its limitations. The view you create has basically merged the pixels of two layers and it is not always that clear which features come from the upper or lower map.
I felt we needed a way to emphasize “interesting” pixels (whatever that maybe) in one map more and to filter out the rest. Than you would see only partially one map, the interesting bits, and keep the rest of the underlying map. To do this ILWIS has two methods.
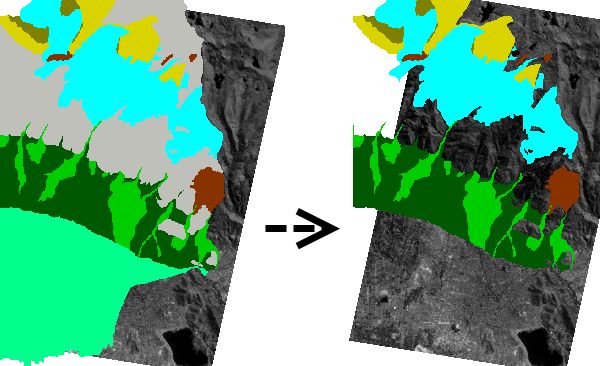
- Class maps may make some of their class fully transparent. In the legend one can deselect classes which than become fully transparent. You get than a picture like this
Two classes have been deselected and the underlying map becomes visible.
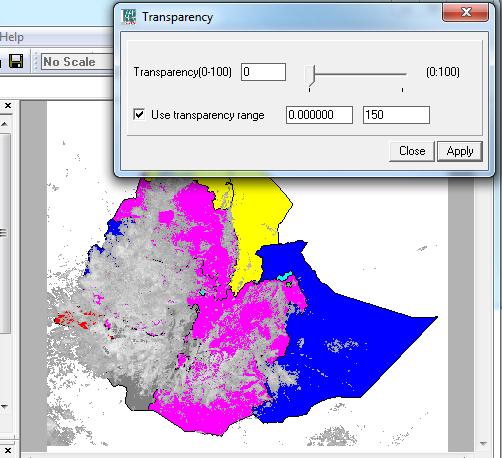
- A value range can become transparent. In the beta you already have the interactive representation (discussed in an earlier blog), in the internal version I have(2011-11-29) I have added two, related, extra options. The first one is directly through the tranparency form of a layer.
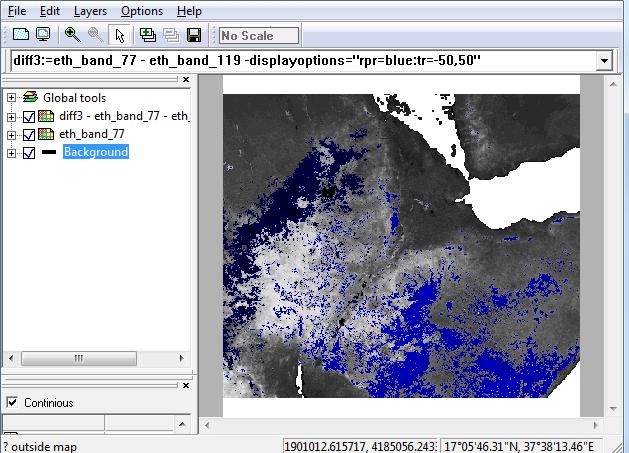
- In this you see a range of values(0-150) being indicated as being 100% transparent and the underlying polygon map becomes visible. Related to this is the “command-line” method. In the internal version each mapwindow has a commandline that is similar to the command line of the mainwindow, Similar, but not 100% equal. Calculated maps from that command line are automatically added to the mapwindow. It has one extra option. The ability to add a displayoptions parameter that describes how the added map should be rendered. One of the parameters in there is similar to the transparency in the form. Below is such a result( with the calc expression)
3D orientation
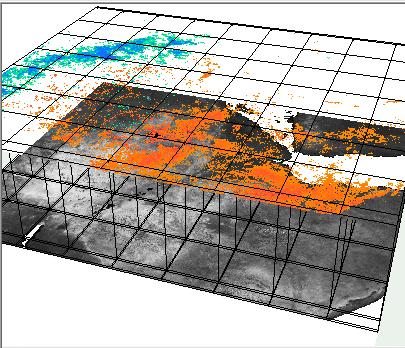
Another way to reach the same goal is using 3D. It is not as flexible as the previous method but it might be usefull some cases. Below is a combination of the two methods with a 3D grid to get a better orientation.
3D is more usefull in this respect when you have 3 or more layers (geologist studying layers in the earth use this view for example).
Blink
This is a special way to detect differences between two raster maps. It of course only relevant for two (or more) maps that are mostely the same but might differ on a number of places. One can make a small maplist with the maps, animate it and detect the differences.


Leave a Reply