![]()
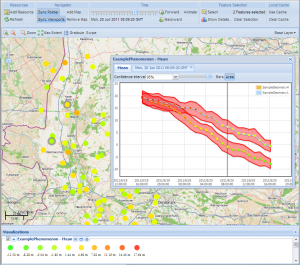
The Geostatistics community is proud to present its newest software project: Greenland. Greenland is a client-side tool to render quality-aware geospatial data. It is implemented as a JavaScript web application using OpenLayers and ExtJS, leveraging HTML5 features, such as the canvas element. It is based on work originally started within the UncertWeb project – “the visualization client” – and is now also developed further within the GeoViQua project. Therefore we decided to join efforts, move the code up in the repository to the main level, and give the software a new name (and without acronyms this time!).
Some of the features of Greenland:
- Time-aware and quality-aware visualization with OGC WMS (Web Mercator)
- User-defined number of (optionally synchronized) adjacent maps
- Intuitive options for ordering and managing layers between and within maps
- Analysis functions (feature info, layer swiping)
- Addition of data sources at runtime
- Permalinks
- Visualization of NetCDF data (automatically with quality tagging)
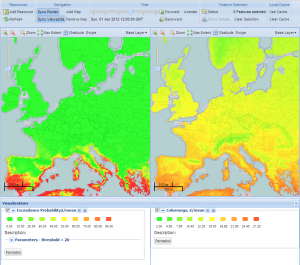
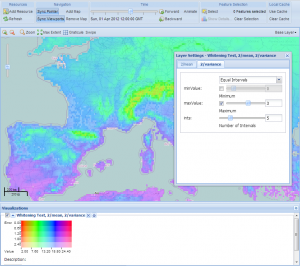
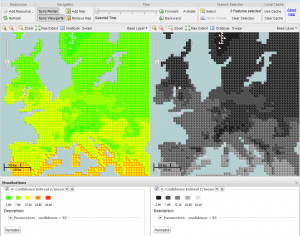
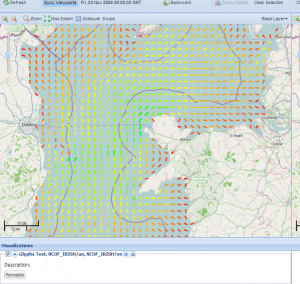
- Uncertainty visualization methods: contouring, whitening, glyphs, confidence triangles, customizable scale ranges and color schemes
- Visualization of geographic features (O&M/O&M2 encoded vector data (XML and JSON notation), points, lines, polygons)
- Support for encoded uncertainties using UncertML, including detail views of encoded distributions and realizations, various styling options of features (shape, size, color schemes, etc.), animations
We publish our code in the 52°North repository under the Apache 2.0 License for easy reuse in many different applications. There is no release schedule planned – just use the source code trunk and enjoy the latest features in a stable version (and if not – report a bug). Get started with the examples and the live demo now and let us know what you think!
Thanks for share. God luck for you