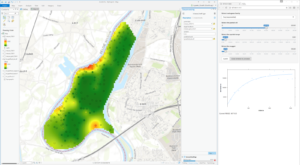
ArcGIS is the central tool to handle and derive geoinformation in many applications. However, the standard kriging capabilities only include a few covariance functions and hide the estimation and fit quality of the semivariogram to a large degree. R is less appealing for working with maps, but features a variety of statistical, i.e. geostatistical, extensions. In this showcase, we exploit the semivariogram modeling and kriging capabilities of the gstat R package. In order to give the user visual control over the estimation procedure and the model selection, we use the Shiny framework to realize an interactive graphical user-interface for the semivariogram fitting step. This tool hides the entire R implementation from the user, but delivers a good deal of the geostatistical power to perform kriging.
Based on the R-bridge, a single R script file is integrated into ArcGIS as a toolbox. This allows the user to define the input feature layer and the target points in the standard ArcGIS layout. During execution of the script, the inputs are coerced to a SpatialPointsDataFrame and a SpatialGrid (from the sp package). The R script starts a local Shiny application that appears in a new browser tab/window.

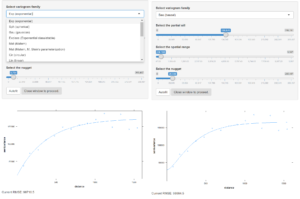
This app shows the empirical semivariogram along with the current fitted model. Drop-down and slider controls allow one to manually select the semivariogram family, partial sill, range and nugget. The manually pre-set parameters can then be optionally, numerically optimized with a single click. The current root mean squared error is shown below the plot. To start the interpolation with the presented semivariogram model, the app needs to be closed via the provided button. On completion of the kriging step, a raster image is written into the location previously given in the toolbox dialogue. This image is also directly added to an active map.
This general set-up is applicable to many other scenarios, in which R tools are provided as toolboxes in ArcGIS. The integration of a Shiny app is an easy and efficient possibility to integrate lightweight graphical user control at the interface between R and ArcGIS. The code of the tool can be downloaded from GitHub.
Hi, this is really interesting.
I’ve been trying to implement this but get a C stack limit error when rendering the app. Have you had this happen before? It seems to be shiny/arcmap issue as I can get this working from rstudio
Thanks for the example