Introduction
With the increasing impacts of climate change on our everyday life, the question arises: how well are we prepared for its effects? We will be confronted with more frequent and intense heat waves in the near future, which will especially challenge the citizens of bigger cities.
To ensure that life in a big city remains bearable even under such conditions, a design guideline for heat resilient urban areas has been developed in the Netherlands and presented by Kluck et al. (2022) during the EGU 2022 in Vienna. This guideline states that all residents of a big city should be given the opportunity to cool down in a public space. As a result,no residential building should be more than 300 meters away from the nearest cool spot – defined as an area with at least 200 m² shade, enough benches, enough vegetation (pref. park of min 1000 m²) – and should also have access to sunny areas.
My work
On the basis of this definition, I have collected all public areas in Münster that provide at least 200 m² of shadow in the summer months and are not interrupted by a road. I also included public swimming pools as well as sport fields, even though public access might be restricted, but they fulfill all the other criteria. I excluded smaller areas located next to big roads or railways, as well as areas that can’t be reached as a pedestrian. Furthermore, I excluded allotments that only allow access to a private community. To identify places as cool spots, I analyzed satellite imagery through Google Maps, OpenStreetMap data and my personal experience of living in Münster.
I created the Cool Spots Map proceeding as follows:
- Create new QGIS map
- Set Background
- Import OpenStreetMap basemap
- Add basemap to the map
- Set coordinate reference system to “WGS 84/UTM zone 34N”
- Add cool spots to the map
- Add new polygon layer called “Cool Spots” to the map
- Install “QuickOSM” plugin
- Download forest areas as OSM data and add them to the “Cool Spots” layer
- Identify areas as cool spots by using satellite imagery, OSM data and personal knowledge
- Add areas identified as cool spots to the “Cool Spots” layer
- Create different distance layers
- Buffer “Cool Spots” layer by 300 meters
- Create layer with the city area
- Create the difference of the city area layer with the buffered cool spots layer to get the “>300m” layer
- Buffer the “Cool Spots” layer by 300, 225, 150 and 75 meters
- Create the difference off the bigger with the smaller buffered areas
- Rename the resulting layers as “0m-75m”, “75m-150m”, … , “225m-300m”
- Export the Map
- Create a new print layout in QGIS
- Add the Map to the print layout
- Add card legend to the print layout
- Print to File (PDF)
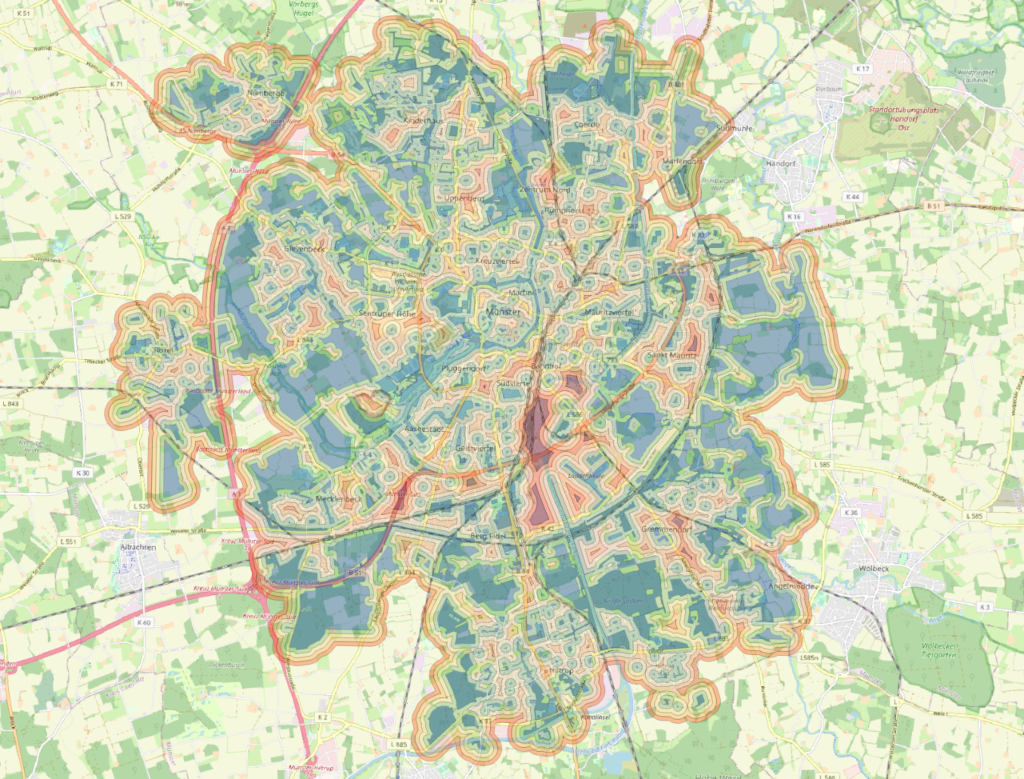
Figure: Distance to cool spot analysis applied to the city of Münster.
Conclusion
In Münster, only a few areas are more than 300 m away from the nearest cool spot, leaving only some small areas in the south. These spots are mainly used by traffic and are not residential areas therefore they can arguably be neglected.
The reason behind Münster’s success, according to the definition of heat resilient urban areas, is that there is a high density of great recreational places, such as the “Aasee”, the “Dortmund-Ems-Kanal” and the car-free “Promenade”. There are also a number of smaller playgrounds distributed throughout the residential areas.
Disclaimer
Since I did not have live satellite images of Münster, I could not exclude that some cool spots might currently fall short of the required 200 m² shadow mark. Please note that I created this map in August 2022. There will inevitably be smaller changes in the future. Moreover, all data has been collected and digitized individually and some selections are subjective to some degree.
References
Kluck, J., Kleerekoper, L., Solcerova, A., Erwin, S., Klok, L., de Groot, M., and Koekoek, A.: Distance to cool spots, a practical design guideline for heat resilient urban areas, EGU General Assembly 2022, Vienna, Austria, 23–27 May 2022, EGU22-10358.

Leave a Reply