What Climate Change Means for Local Communities and Beyond
Introduction
The news often reports about climate change, rising occurrences of natural disasters, global emissions, and reducing CO2 for the generations to come. We hear about policy and the endless debates, agreements, and goals set by the world’s greatest Green House Gas (GHG) emitters. But what does that mean on a localized level? What does climate change really look like for people like you and me? With all the devastating natural disasters each and every year, why haven’t we come up with better solutions to help the people and communities that face them? What are the best, and worst, possibilities for our shared future? How can we adapt to our ever-changing climate?
While these are complicated questions accompanied by equally complicated answers, one of the most essential pieces of these conversations – before actions, policy, or changes on the ground can be made – is one small, very powerful, four letter word: data. In order to make informed decisions, people need data. They also need common data, so that they are able to make decisions based on the same, centralized and trusted information.
That’s why the DIRECTED Project, part of the Horizons Europe 2020 initiative, has developed the Data Fabric, which has just been launched as version 1. It is an interactive, centralized, web-based platform hosting a multitude of modeled climate data, designed by, and for, the people that live and work in the participating Real World Labs.
The Data Fabric
Based in four different Real World Labs (RWLs) spanning across the EU, the Data Fabric hosts a multitude of data. This includes, but is not limited to: pluvial, fluvial and coastal flooding event scenarios based on IPCC climate change projections, real-time sea level and precipitation forecasts, and monthly climate projections spanning the entire EU, with variables such as precipitation depth, daily minimum and maximum temperatures, wind speed, and shortwave radiation, among others.
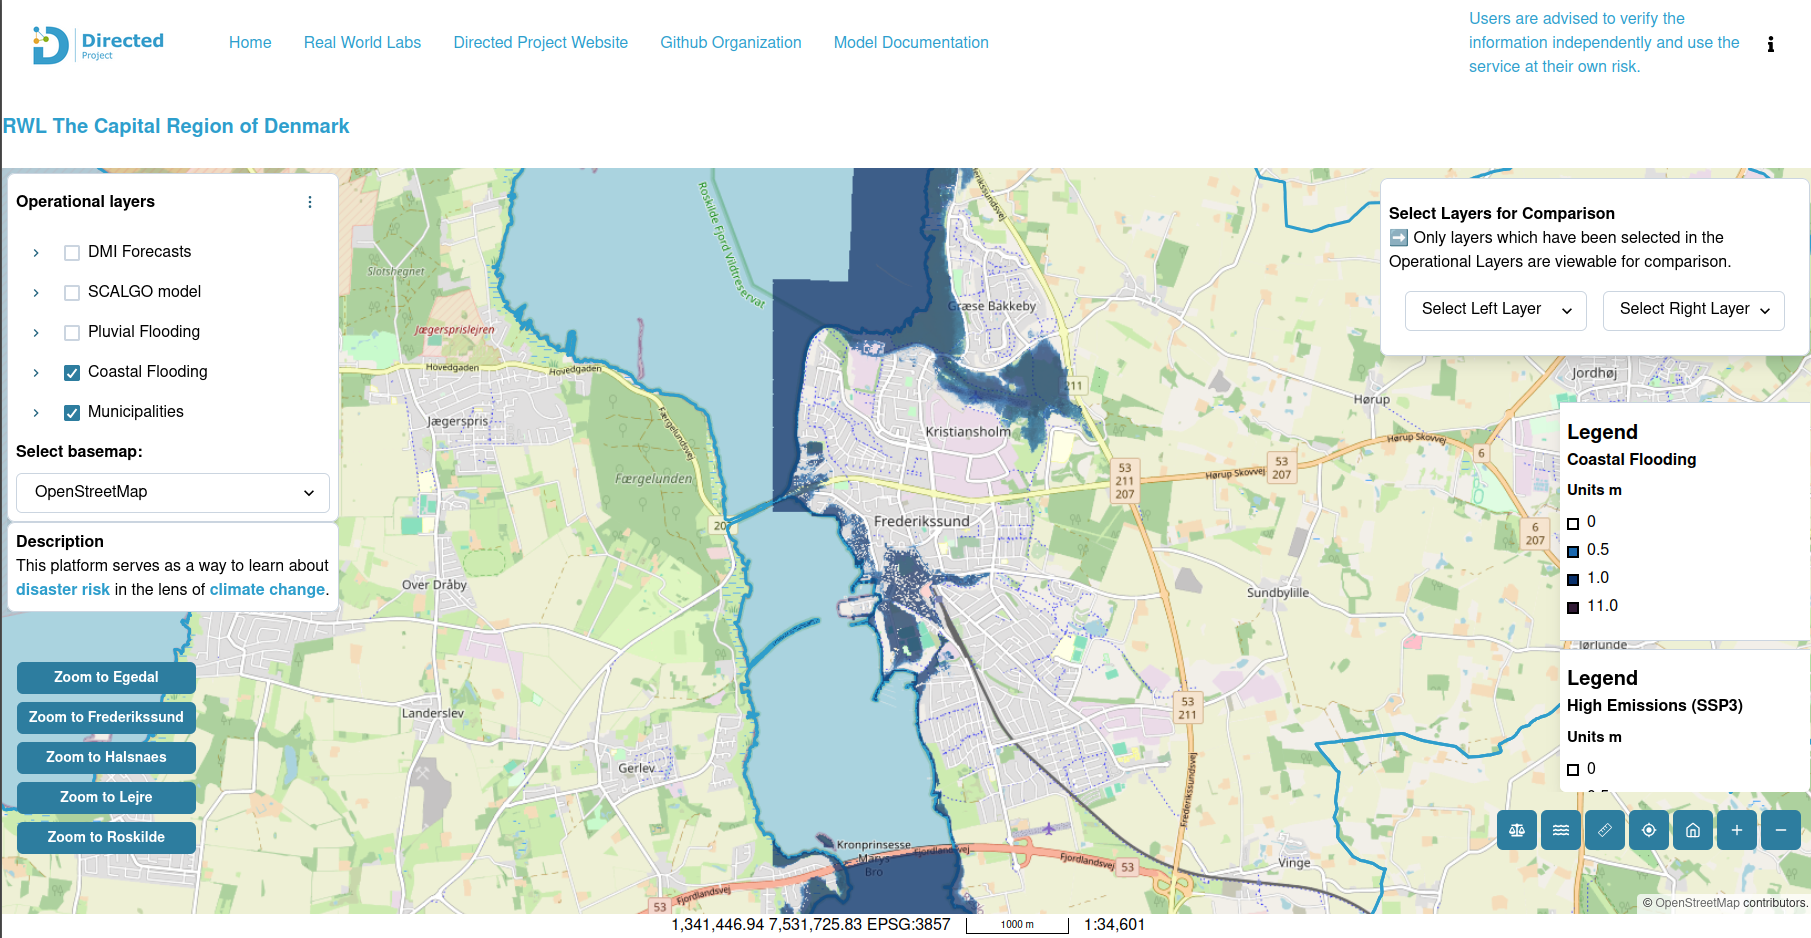
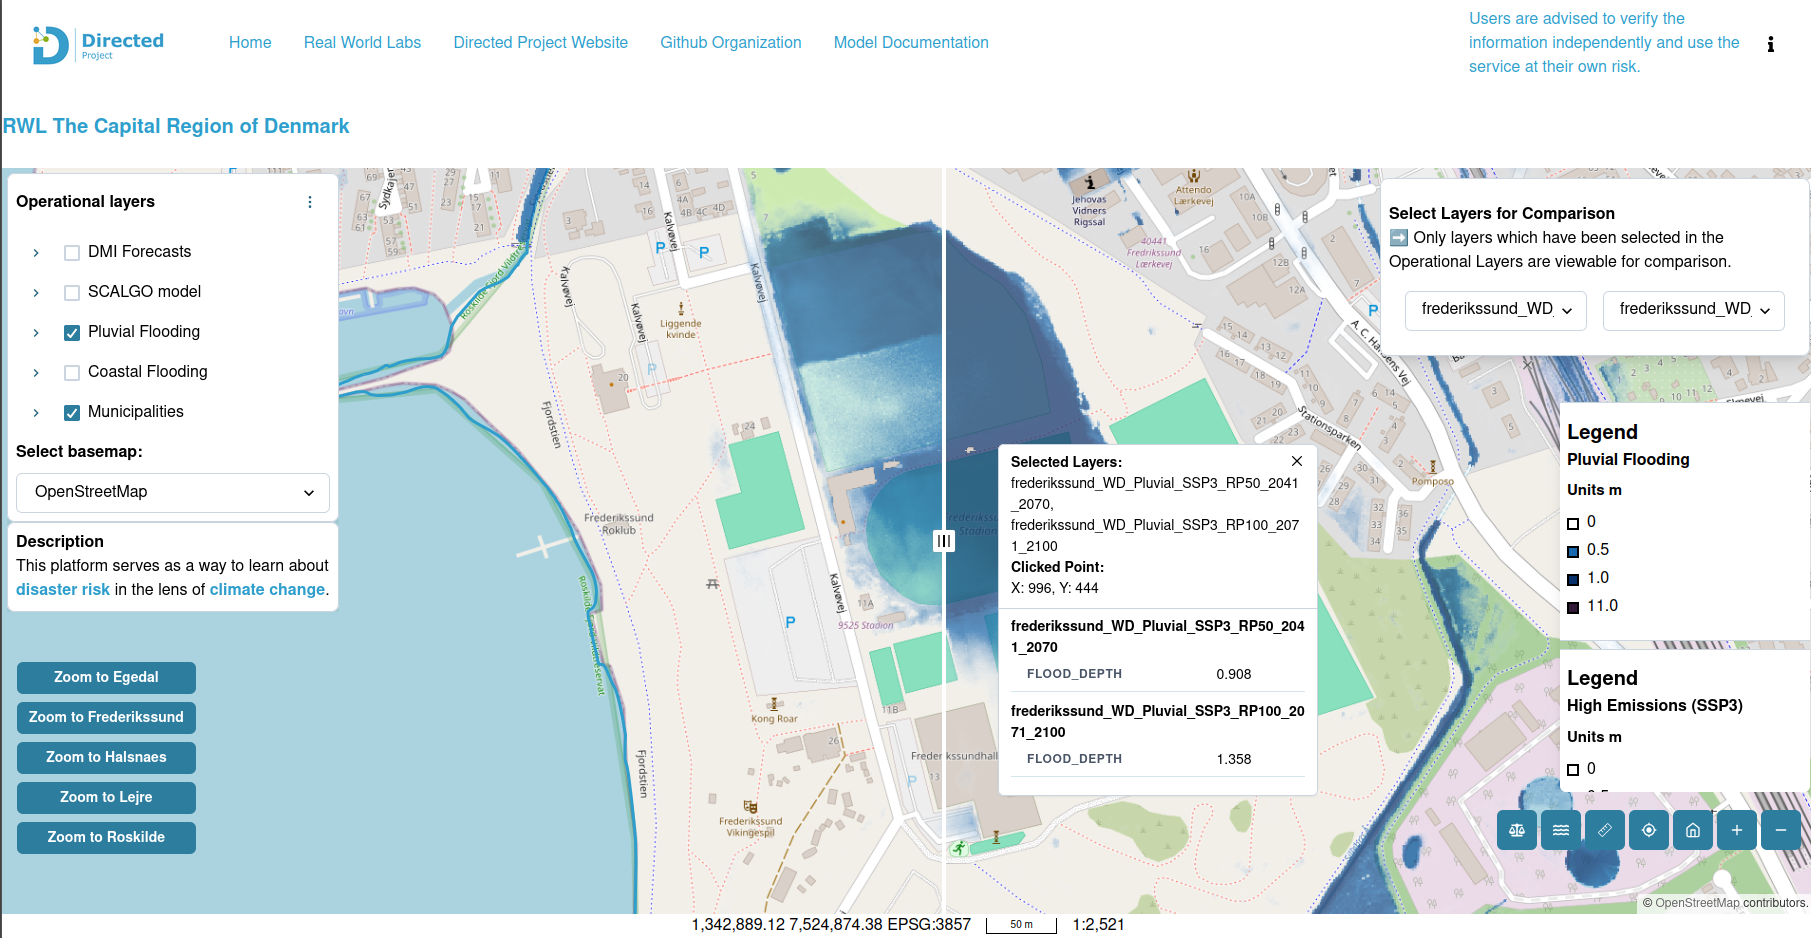
For pluvial and coastal flooding climate change scenarios, various Shared Socioeconomic Pathways (SSP) and Representative Concentration Pathways (RCP) can be seen in the Data Fabric, particularly in the Copenhagen RWL (Figure 1). SSPs are future climate scenarios that show how different socioeconomic developmental pathways may affect climate change mitigation under different degrees of global warming (1). These climate scenarios were run with the SaferPlaces, Scalgo, and RIM2D models for both pluvial flooding and coastal flooding events. This data could be used in the case where, for example, an end-user would like to see if their home or the surrounding areas are at-risk for flooding and what depth those flood waters could reach. They could view this in a high-risk scenario (3.5 degrees of global warming) and a lower-risk scenario (2.5 degrees of global warming) to see to what extent their community is at-risk in each climate scenario.
Model outputs from the DTU Cost-Damage Model additionally show multi-sectoral economic damage costs for coastal flooding events under SSP1. The sectors for which damages were calculated include: tourism, road traffic, recreational areas, public services, industry, human, buildings, biodiversity, and agricultural areas. These damage-cost estimates highlight which sectors, namely in the Frederikssund Municipality, could experience the highest economic losses. They provide insight into which sectors should be prioritized for future planning efforts and the implementation of adaptation measures. This framework could also be expanded to other municipalities and regions in the EU, given appropriate damage-cost curves.
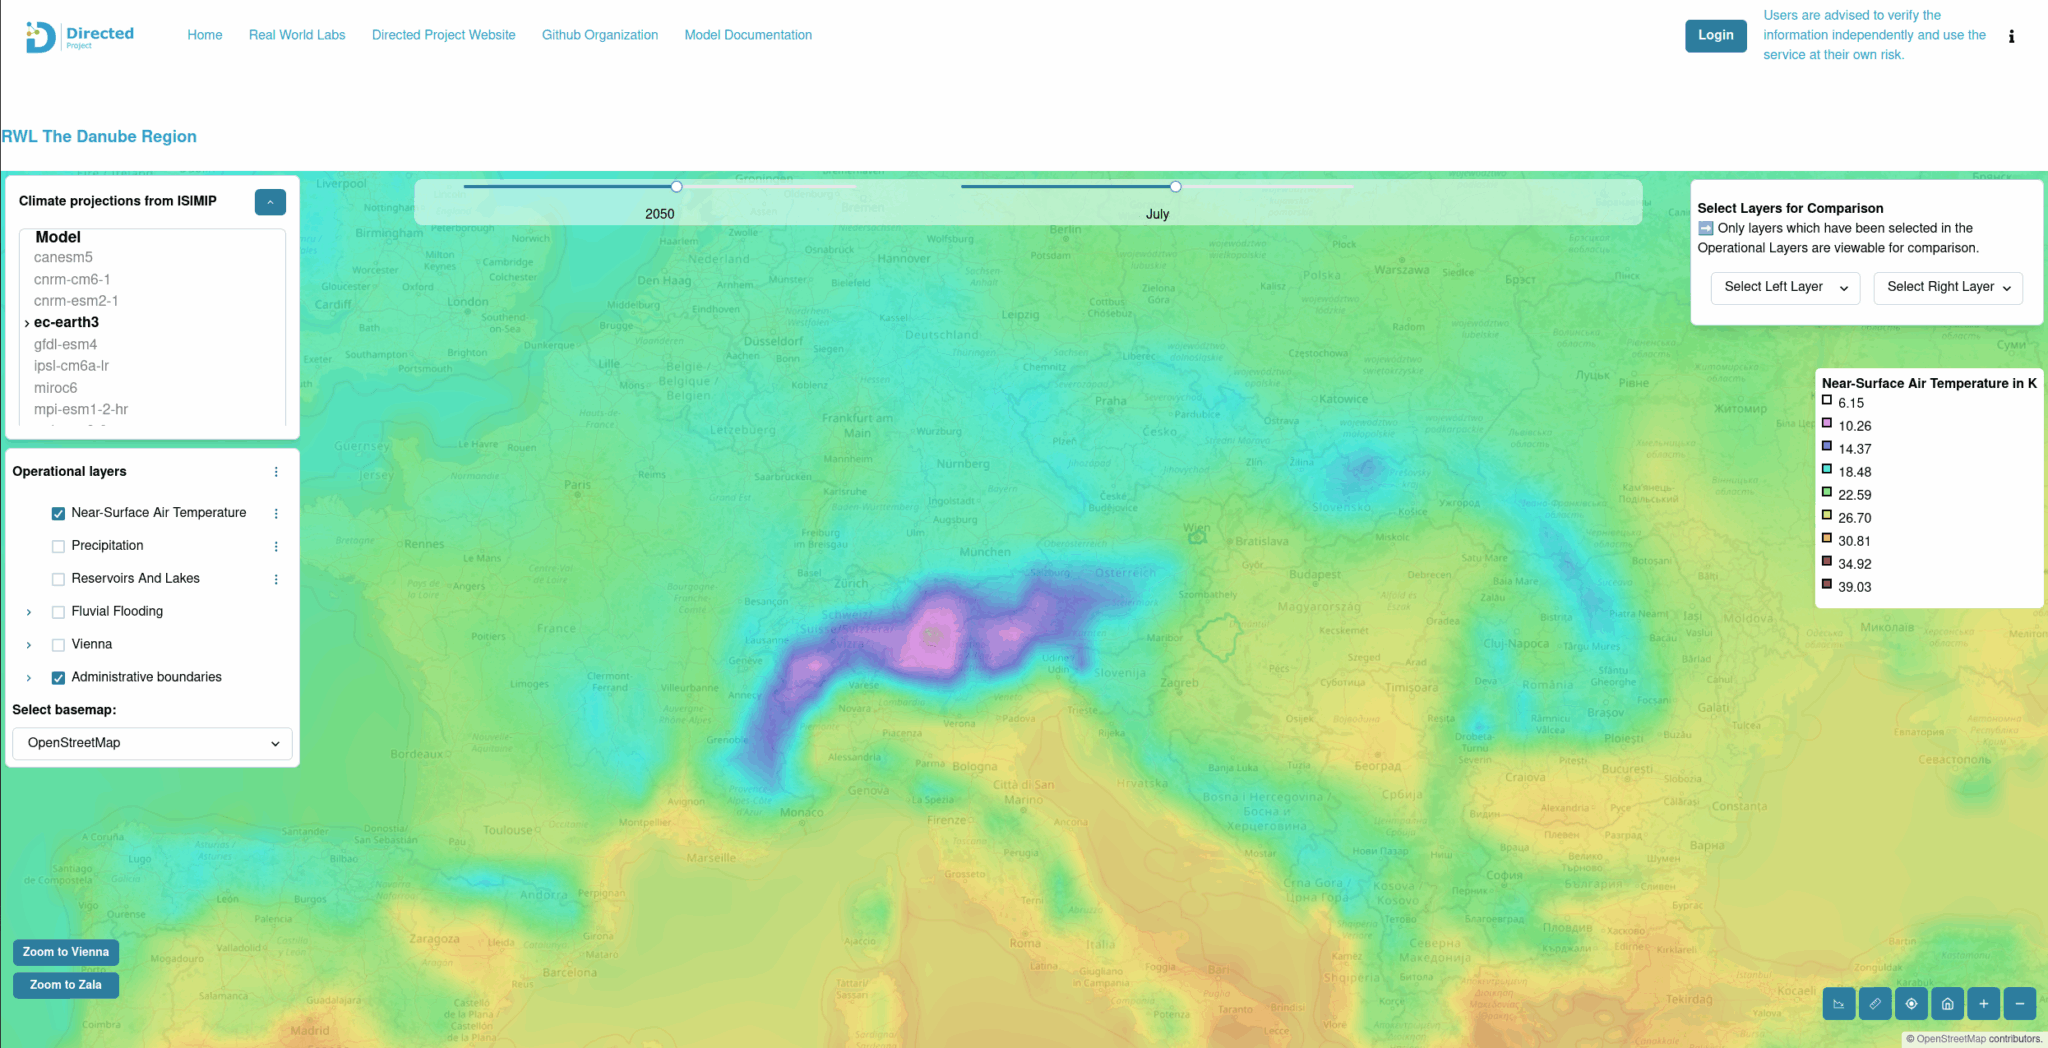
In the Danube RWL, users can interact with Inter-Sectoral Impact Model Intercomparison Project (ISIMIP) data provided by the Potsdam Institute for Climate Impact Research (PIK) (Figure 2). This data provides monthly climate projections spanning across the entire EU, showing humidity, precipitation, shortwave radiation, wind speed, air temperature, daily maximum and minimum air temperatures, and a standardized precipitation evapotranspiration index. These variables are shown for a number of different climate models. They include models such as the Canadian Earth System Model version 5 (CanESM5), EC-Earth3 using coupled component models for atmosphere, ocean, sea ice and land and MIROC6 single model initial-condition large ensemble (LEs). These extensive data sources are seamlessly integrated to provide users an overview of climate projections for different atmospheric conditions. These could, for example, aid in long-term planning efforts to curb the impacts of climate change.
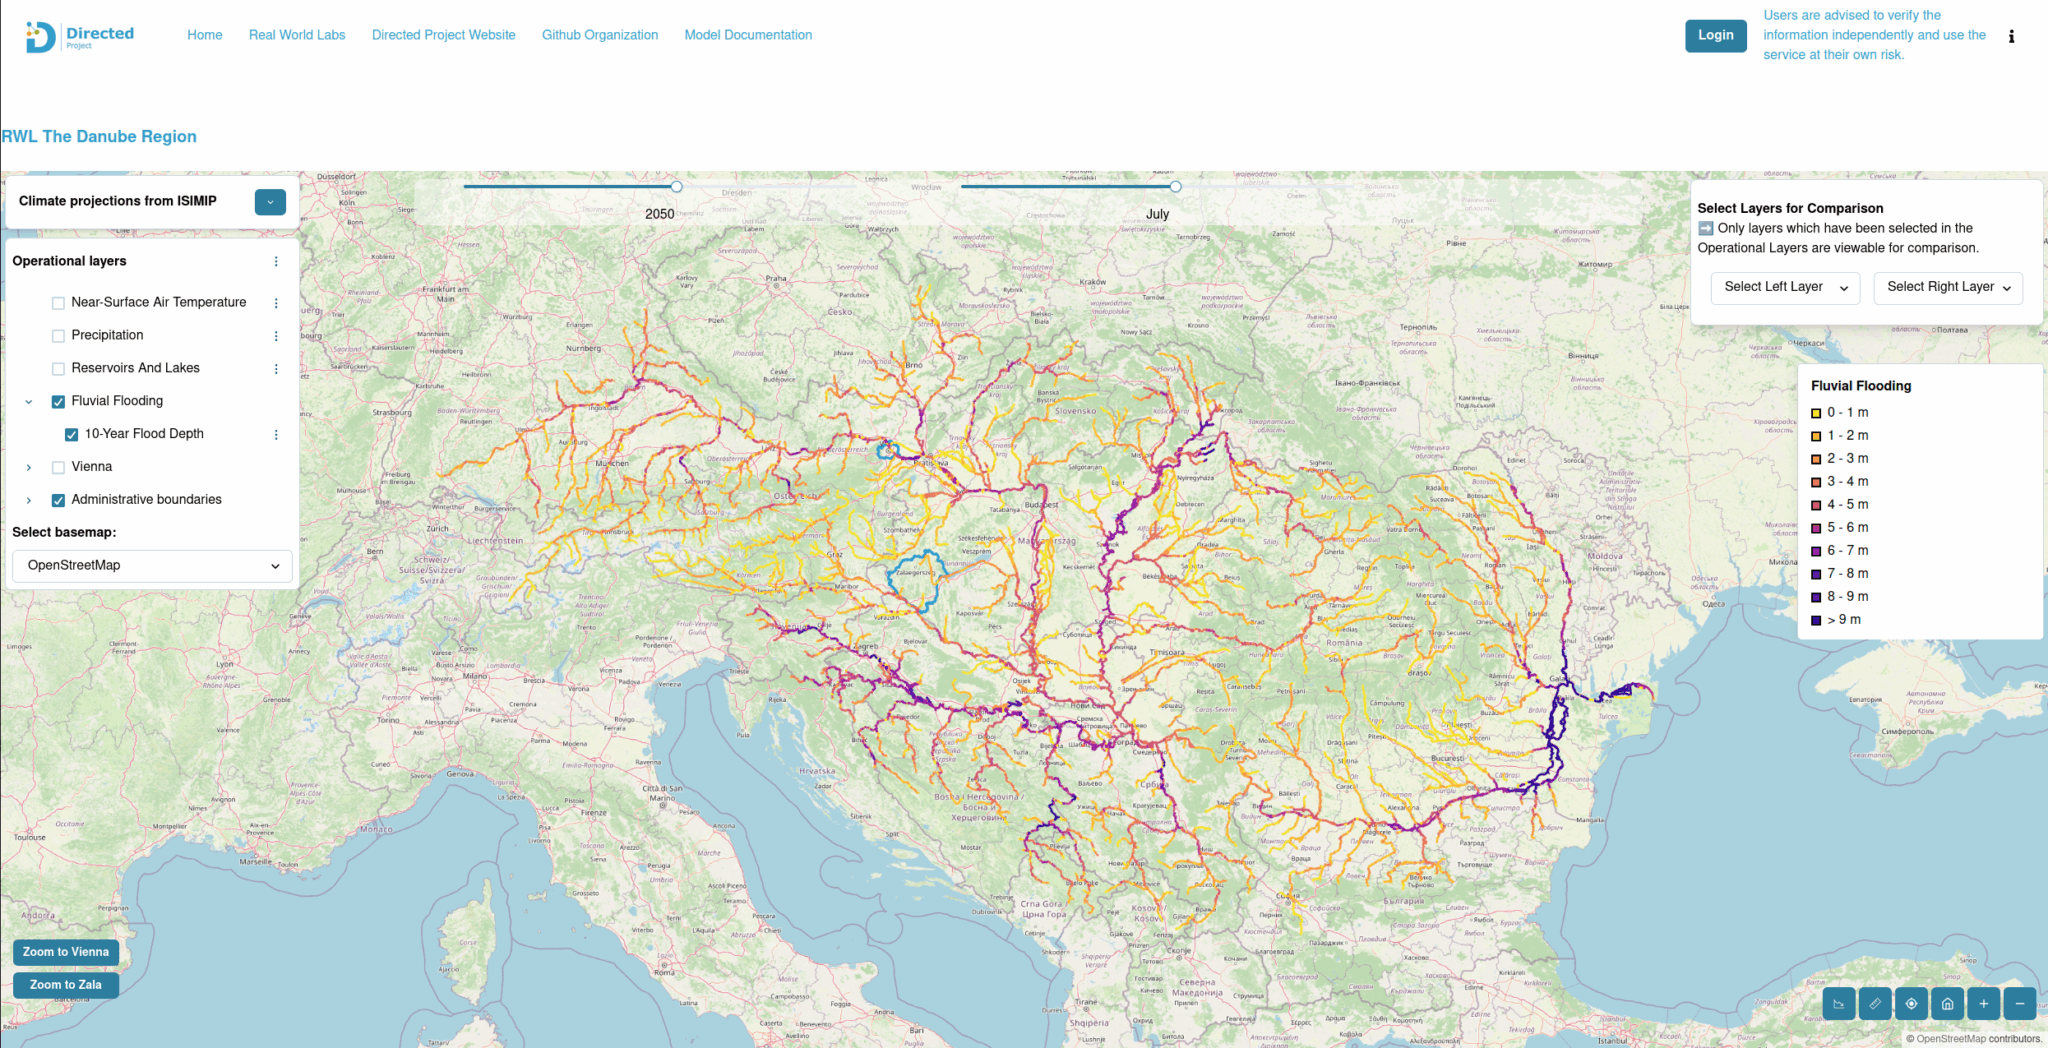
The Danube RWL depicts 10-year flood-depth values for all river networks within the Danube River Basin using the Danube Model. These are the flood-depth values that have at least a 10 % chance of being realized or exceeded in any given year within a 10 year return period (Figure 3). This data could be used to inform an end-user which areas of a river network are at a higher risk of experiencing a fluvial flooding event.
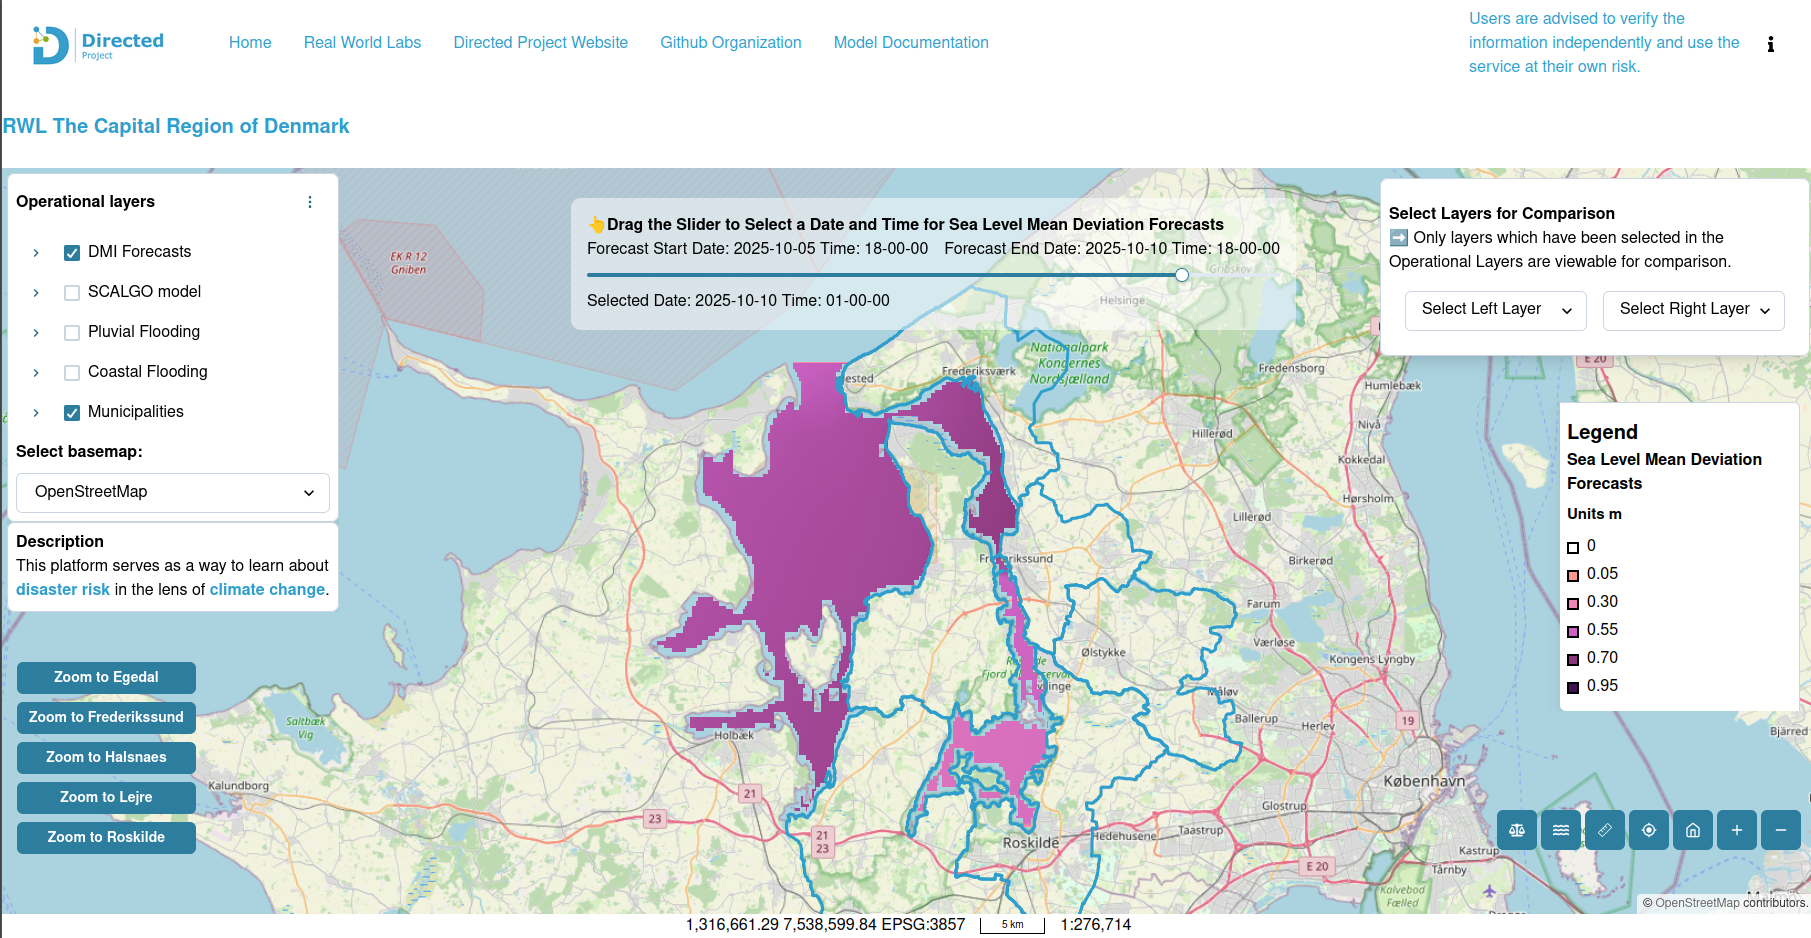
The Copenhagen RWL also includes real-time data in the Data Fabric via the Danish Meteorological Institute’s (DMI) open data API (Figure 4). These data include precipitation rate forecasts, total precipitation forecasts, and sea level mean deviation forecasts. Sea level data is calculated using DKSS, DMI’s forecast model for storm surge (2). This data is available at a forecast range of 5 days. Forecast data for precipitation rate and total precipitation are run with DMI’s HARMONIE model and are available at a forecast range of 60 hours (3). These DMI datasets are updated daily and displayed in the Data Fabric for the Roskilde Fjord area. This RWL explicitly requested this data so that Emergency Management Service (EMS) workers in the field can view it in real time and know when and where the next extreme coastal or pluvial flooding event could occur.
In addition to data from model outputs, one key feature present in the Data Fabric, which can be found in all the RWLs, is the layerswipe functionality (Figure 5). This allows the end user to compare two map layers side by side, making it easy to compare their information and visual representations. An end user could, for example, compare two different SSP scenarios and see if there is any overlap between the two (i.e., am I at-risk in only one scenario? Or in both?). This also enables the easy comparison between different flood models (such as Scalgo and SaferPlaces) to see if there is any level of certainty and/or uncertainty present in the modeled scenarios. It should be noted that this uncertainty is not explicitly quantified in the Data Fabric.
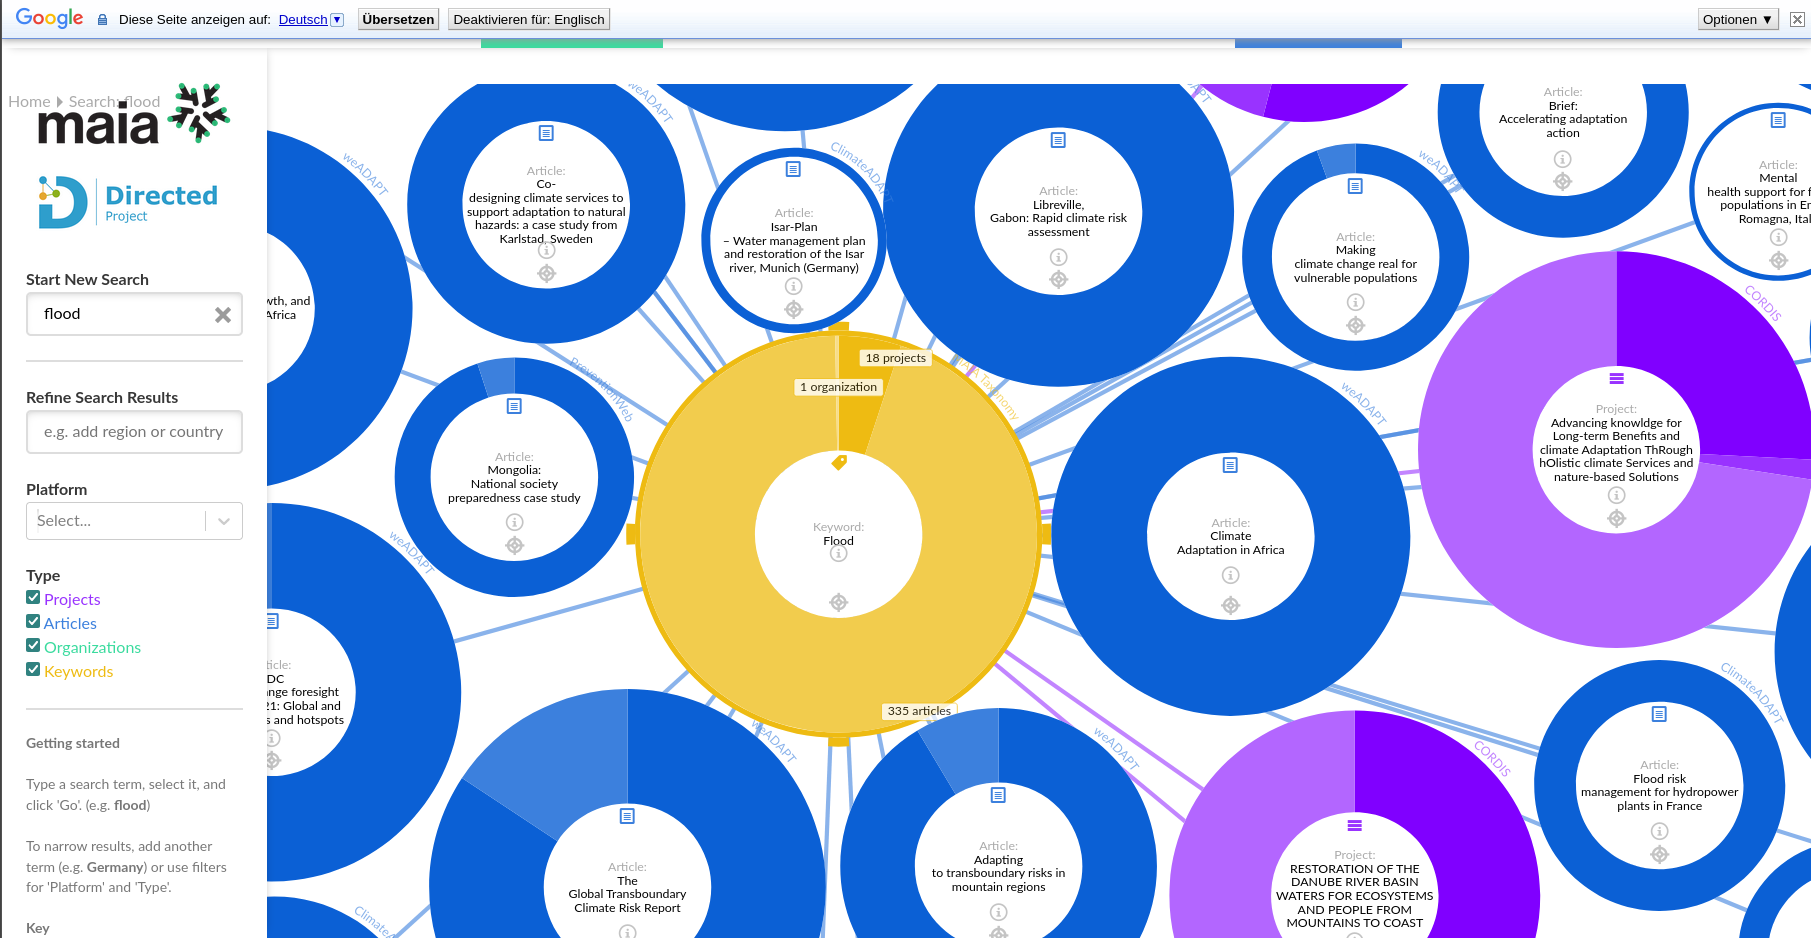
The Data Fabric can also be used as an educational resource. In order to give end users the ability to learn about the content of the Data Fabric, the Connectivity Hub is linked in the Data Fabric (see Figure 6 and links in this blogpost). Contextual terms are linked in the Data Fabric directly from the Hub via API. Users are further able to access the Hub, a comprehensive term search bar and literature search within the Hub’s external web page. Thus, if end users have any questions about the data or want to explore terminology commonly used in the Data Fabric and climate science, they are able to explore these through a user-friendly interface (Figure 7).
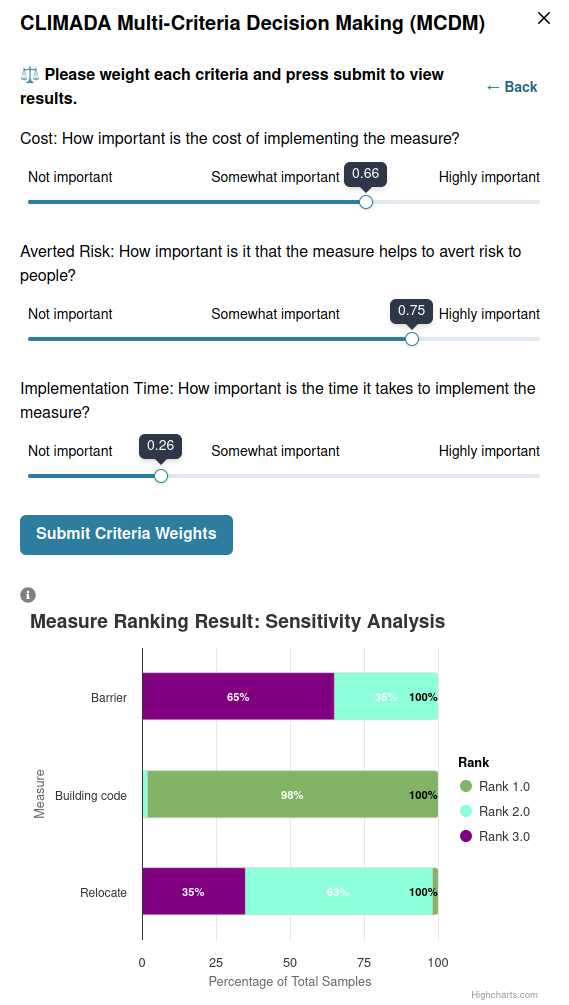
Multi-criteria decision-making (MCDM) refers to a decision which is made based on multiple, often conflicting, criteria (4). It is a collection of formal approaches that seek to take into account a number of different alternatives, to help individuals or groups explore important decisions, while considering multiple trade-offs associated with said alternatives (5). Another key feature of the Data Fabric is its support for MCDM assessments with the CLIMADA model. For example, imagine that an end user wants to evaluate different climate change adaptation measures in a city. The adaptation measures they want to consider are: 1) a sea barrier to protect against coastal flooding events, 2) the changing of a city’s building codes, so that housing in high-risk areas must follow stricter guidelines to protect against flooding, and 3) the relocation of critical infrastructure, such as cultural heritage sites, to areas safe from future flooding events. Each of these adaptation measures have pros and cons. What if one measure is very costly, but longer-lasting than another, less costly, measure? What if the public does not approve of the costly measure, but environmental groups do? These are the kinds of trade-offs that the MCDM can evaluate, so that various groups, actors, and considerations are not left-out of critical decision-making processes. The MCDM in the Data Fabric thus allows end users to weigh different criteria, in order to find the most optimal solution when these external factors are considered (Figure 8). After weighing each criterion on a likert scale, users are presented with ranked adaptation measures. Further expansion of the CLIMADA MCDM in the Data Fabric could include the capability for users to add their own custom criteria.
Concluding Remarks
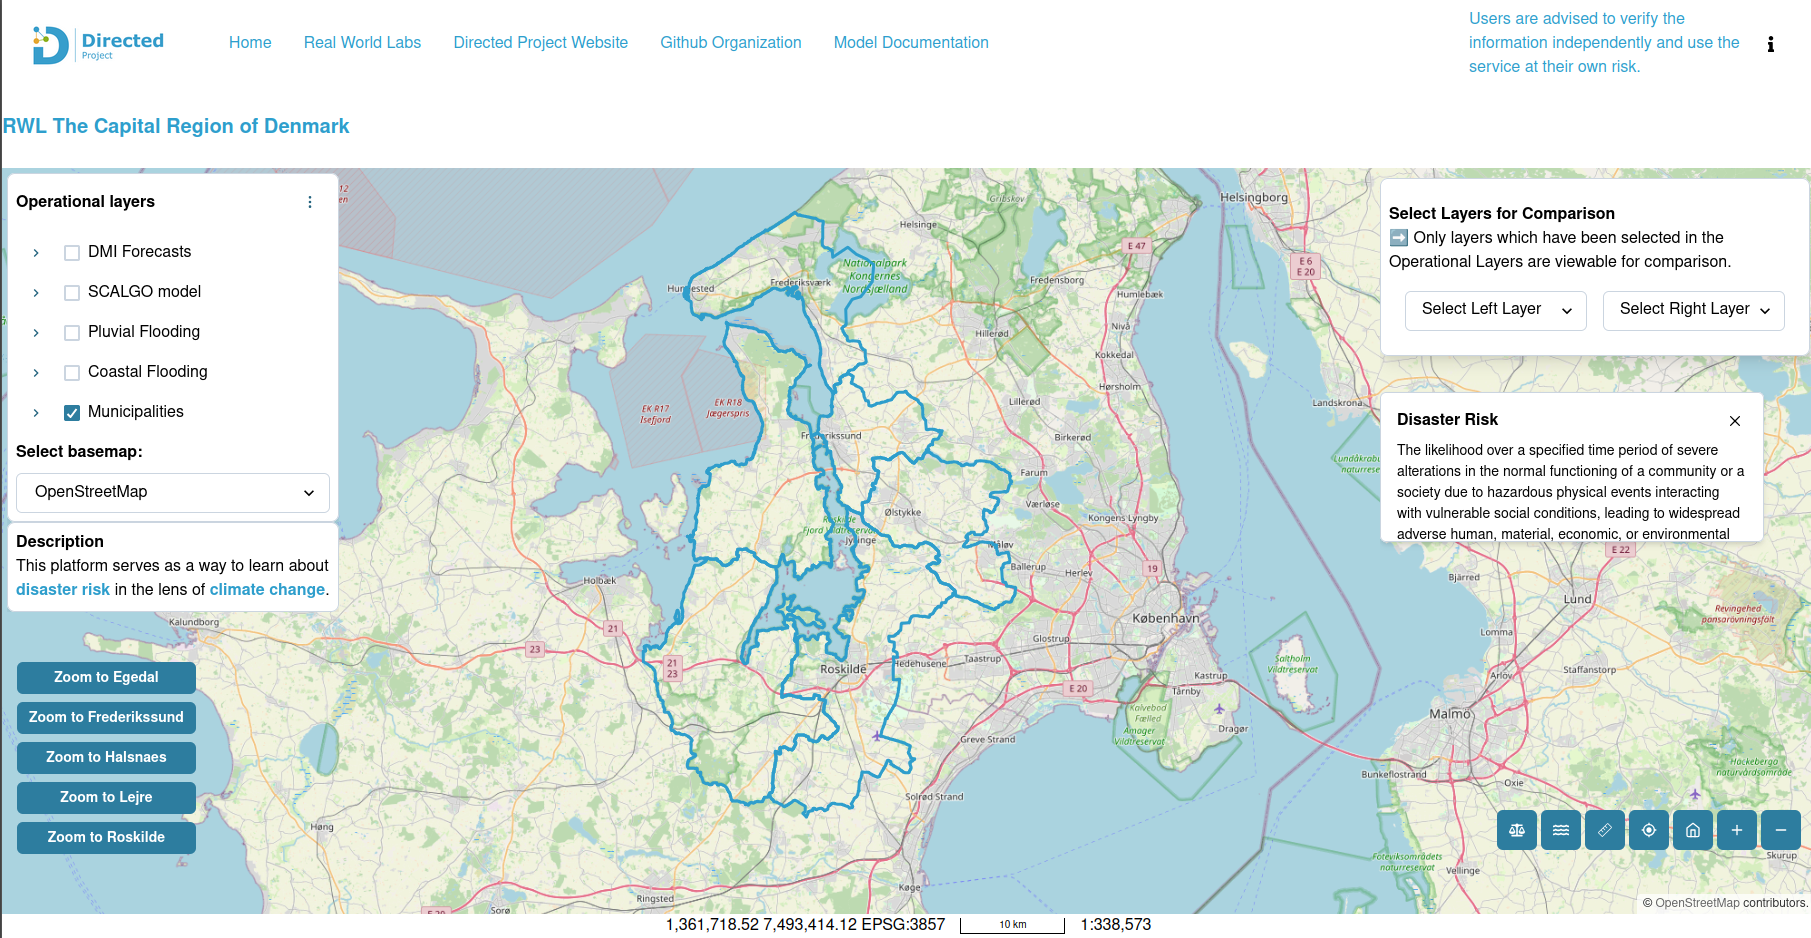
In conclusion, the Data Fabric is a multifaceted web platform that enables end users to view localized climate change data. It serves as a way to empower people to take climate decisions into their own hands and bridge silos between different governmental and localized organizations by showcasing a common data platform to fit their needs. The corresponding RWLs thus exemplify how a platform, such as the Data Fabric, could be expanded to other regions in the EU and beyond as climate change, disaster risk management, and mitigation efforts become integral to the resilience of our shared future.
References
- IPCC, 2019: Summary for Policymakers. In: Climate Change and Land: an IPCC special report on climate change, desertification, land degradation, sustainable land management, food security, and greenhouse gas fluxes in terrestrial ecosystems [P.R. Shukla, J. Skea, E. Calvo Buendia, V. Masson-Delmotte, H.- O. Pörtner, D. C. Roberts, P. Zhai, R. Slade, S. Connors, R. van Diemen, M. Ferrat, E. Haughey, S. Luz, S. Neogi, M. Pathak, J. Petzold, J. Portugal Pereira, P. Vyas, E. Huntley, K. Kissick, M. Belkacemi, J. Malley, (eds.)]. In press.
- “Storm Surge Model (DKSS).” DMI Open Data, opendatadocs.dmi.govcloud.dk/Data/Forecast_Data_Storm_Surge_Model_DKSS. Accessed 7 Oct. 2025.
- “Weather Model (Harmonie) for Dini and Ig.” DMI Open Data, opendatadocs.dmi.govcloud.dk/Data/Forecast_Data_Weather_Model_HARMONIE_DINI_IG. Accessed 7 Oct. 2025.
- Xu, Ling, and Jian-Bo Yang. “Introduction to Multi-Criteria Decision Making and the Evidential Reasoning Approach.” Manchester School of Management University of Manchester Institute of Science and Technology, May 2001.
- Greene, Randal & Devillers, Rodolphe & Luther, Joan & Eddy, Brian. (2011). GIS‐Based Multiple‐Criteria Decision Analysis. Geography Compass. 5. 412 – 432. 10.1111/j.1749-8198.2011.00431.x.
- GitHub: https://github.com/directedproject-eu
Leave a Reply