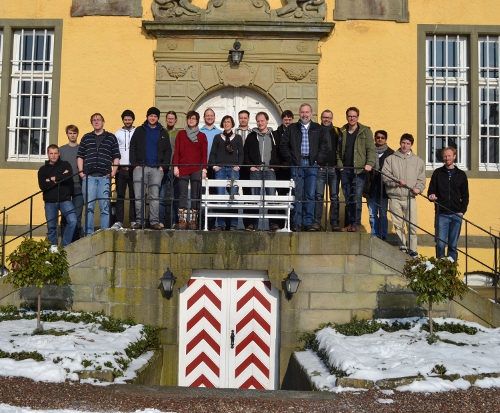
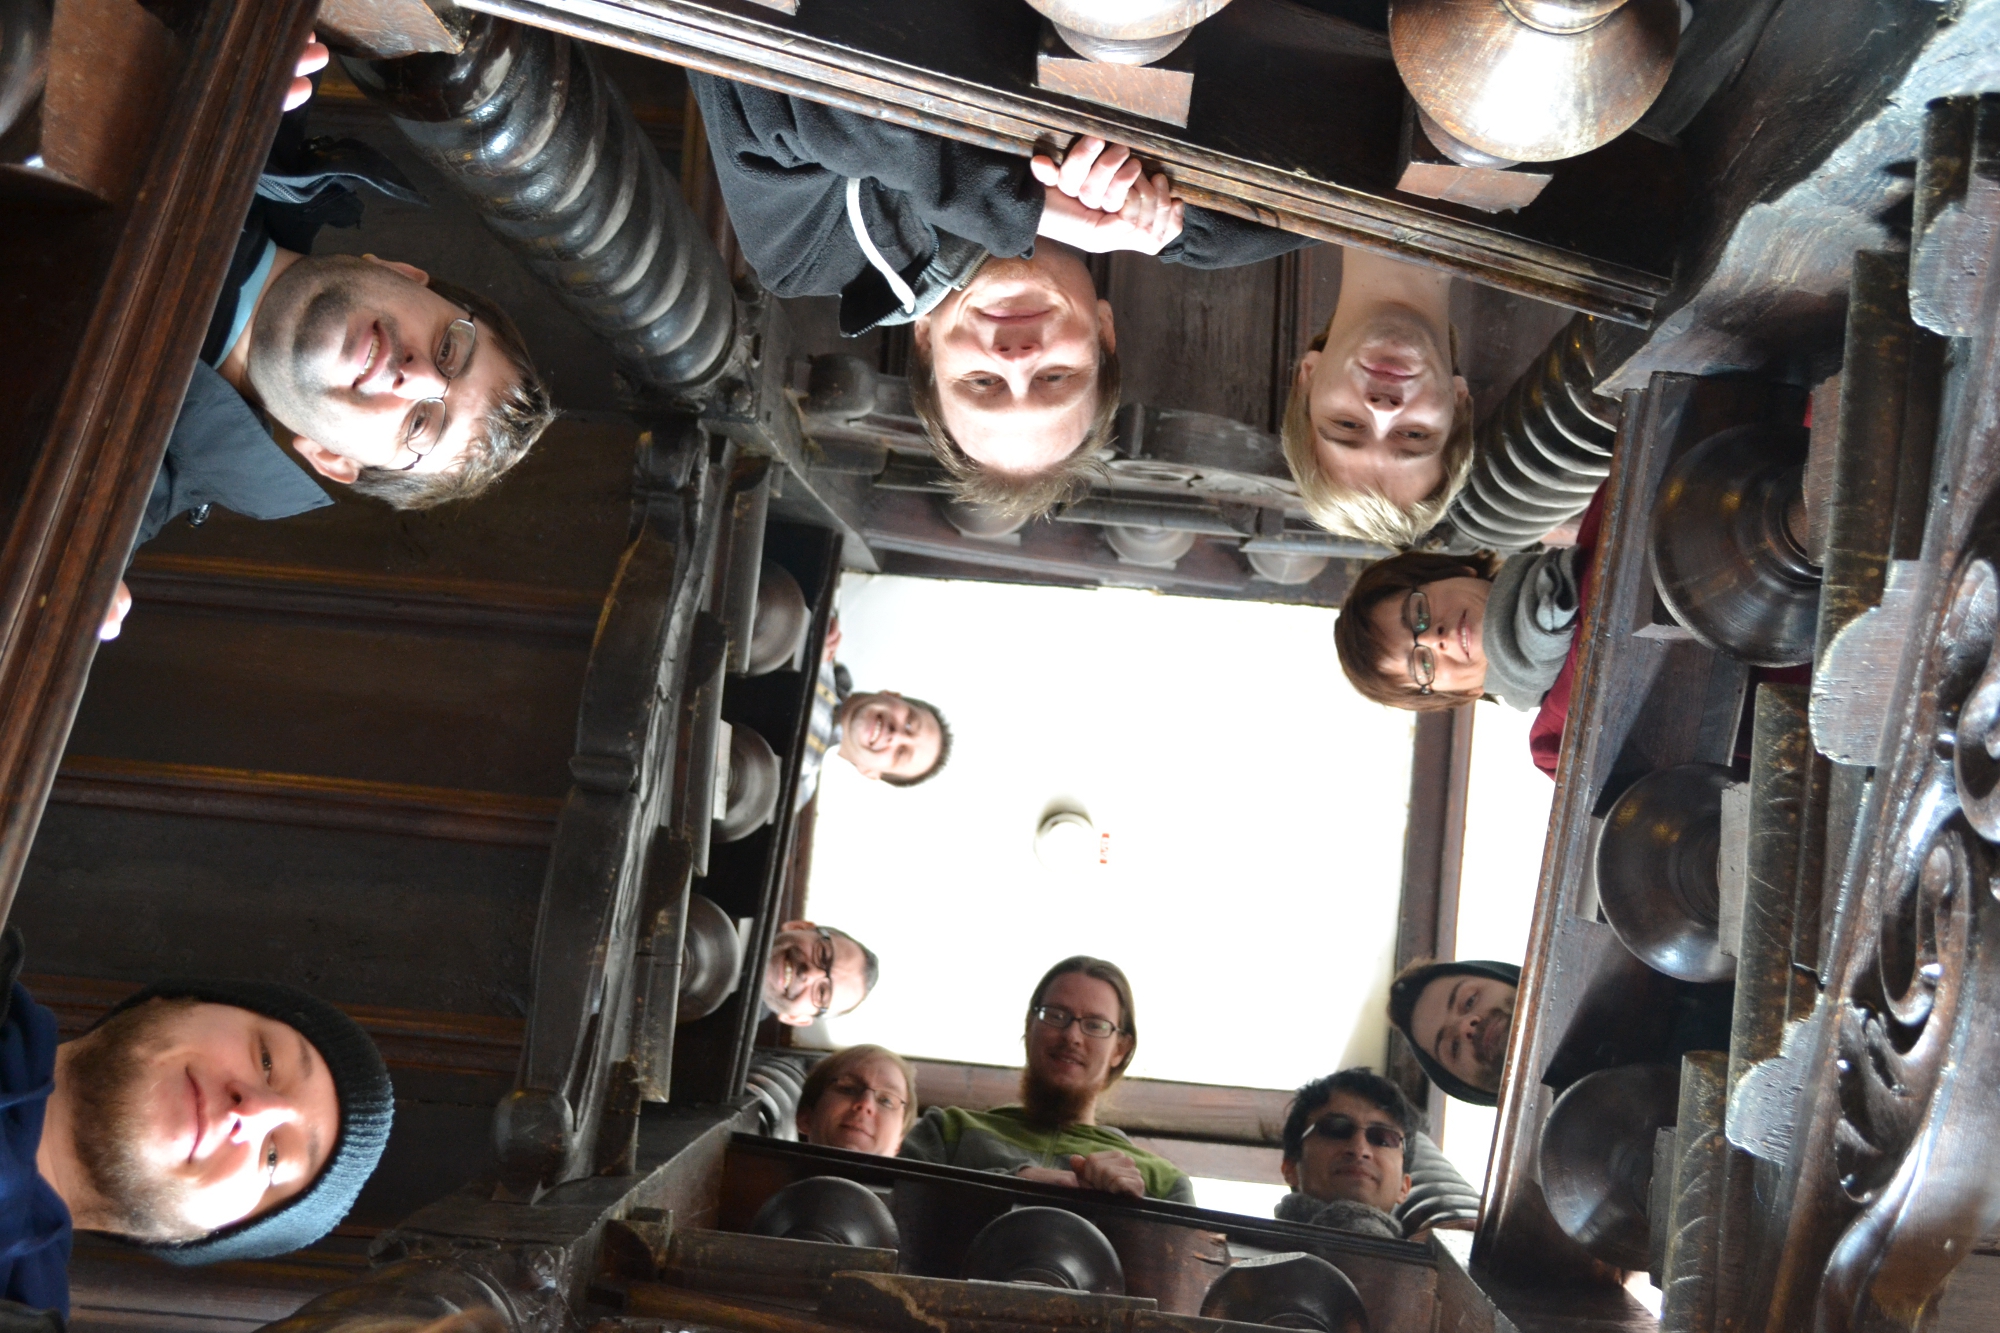
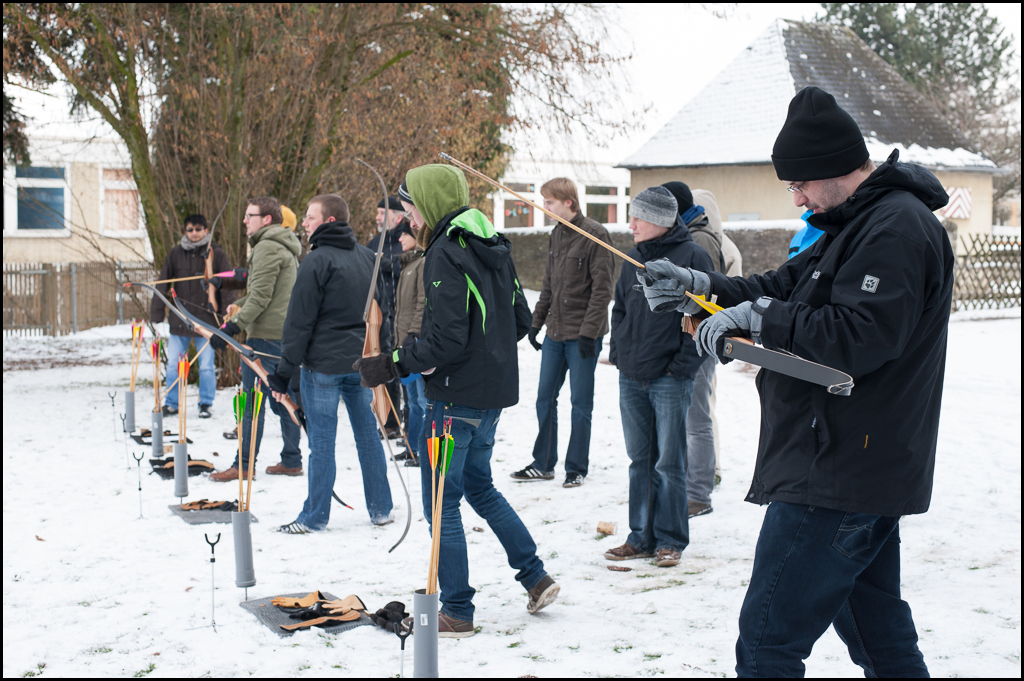
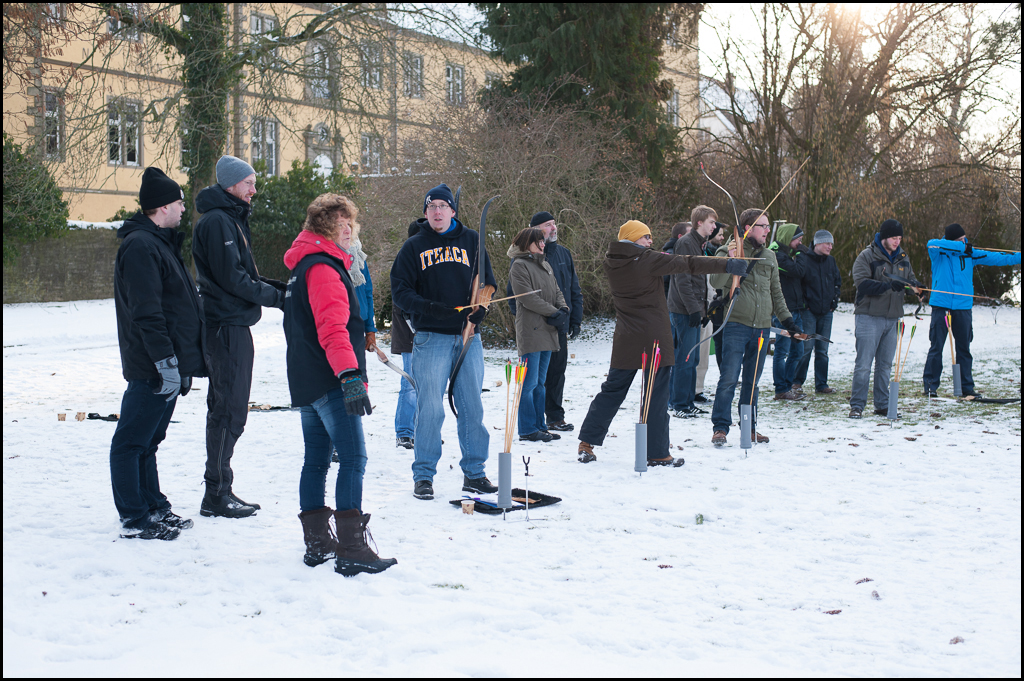
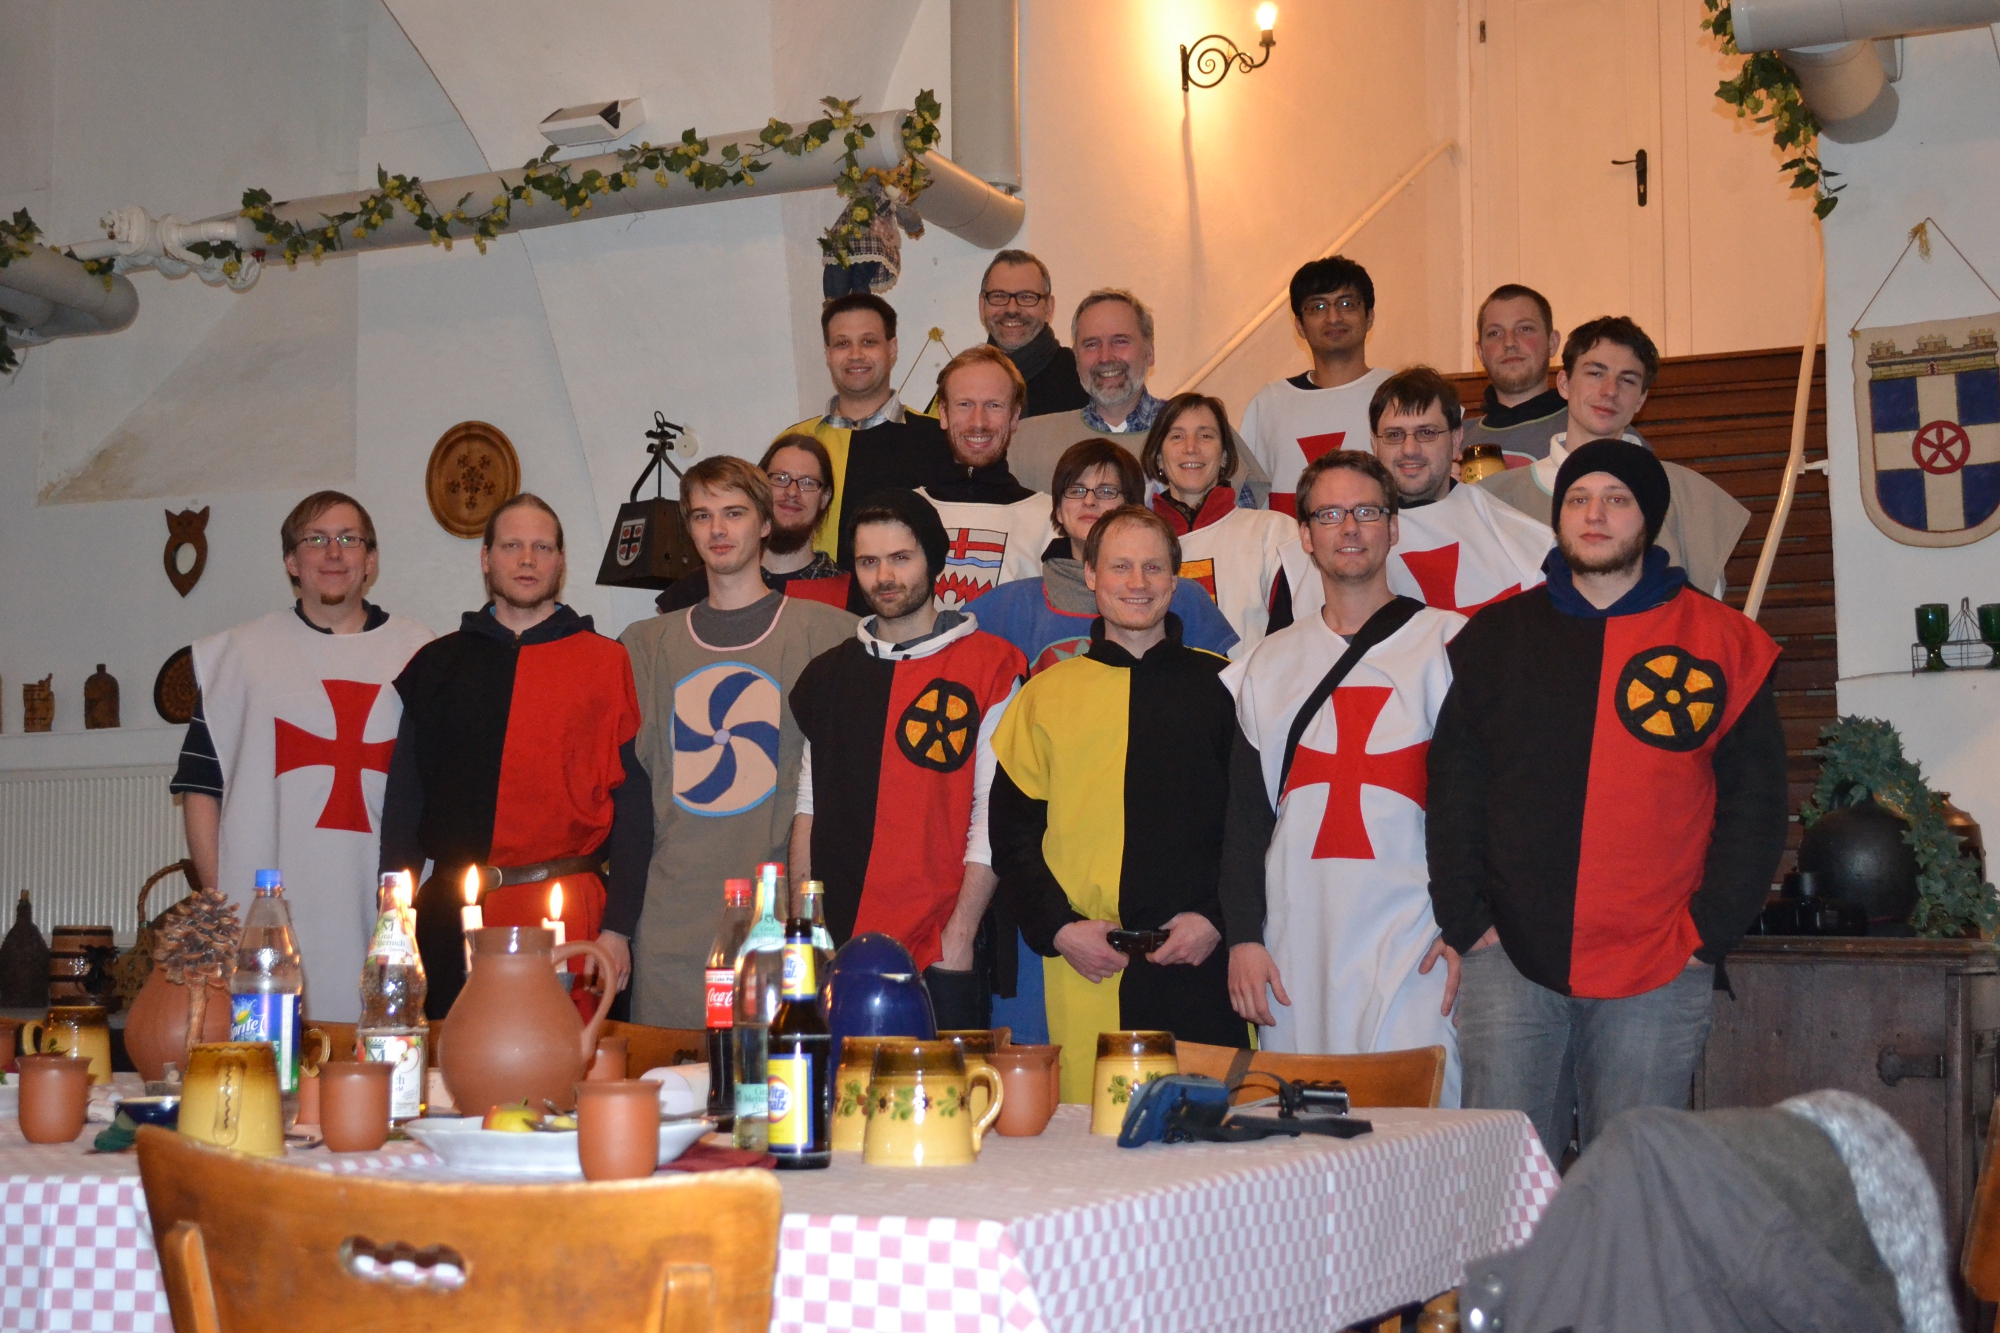
Last month, 52°North staff visited the Schloß Eringerfeld for our yearly retreat. We wracked our brains from thursday through saturday, targeting 52°North road maps and aligning common goals and strategies for 2013. We braved the cold and snow to discover hidden archery talents and topped off the event with a medieval banquet in the castle dungeon! All in all it was a very informative, productive and constructive event.
Software developer position available @ ITC
ITC is a partner in the European Marie Curie Initial Training Network “CHANGES”. The CHANGES network will develop an advanced understanding of how global changes (related to environmental and climate change as well as socio-economical change) will affect the temporal and spatial patterns of hydro-meteorological hazards and associated risks in Europe; how these changes can be assessed, modelled, and incorporated in sustainable risk management strategies, focusing on spatial planning, emergency preparedness and risk communication.
One of the main components of the project is the development of a Web-based Spatial Decision support System to analyze the effect of risk reduction planning alternatives on reducing the risk now and in the future, and support decision makers in selecting the best alternatives. ITC is responsible for the development of the data analysis modules within the SDSS.
Software developer position open at KISTERS
52°North Associate Partner KISTERS AG is looking for a software developer for web technology. The tasks at hand:
- product development and maintenance of web solutions in the product fields Hydrology und Energy
- analysis, design and realization of browser-based software solutions
- modeling and documentation of software architecture and software components
More information (in German) can be found here or contact Dr. Heinz-Josef Schlebusch )
Visualization Tool Assessment
The UncertWeb FP7 EU project has developed methods and open source tools for uncertainty propagation in web-enabled environmental modeling chains. One of these tools visualizes probabilistic spatial and spatio-temporal data in a browser. To assess the usability of this visualisation tool, the Institute for Geoinformatics prepared an online survey.
Please take the time and spend 20 minutes to get to know the tool and give your opinion about it! We will need this before Jan 15, 2013 23:59 UTC.
The questionnaire is available here.
For those of you who are curious, yes, this is the tool that will continue under the name GREENLAND!
- « Previous Page
- 1
- …
- 13
- 14
- 15
- 16
- 17
- …
- 27
- Next Page »