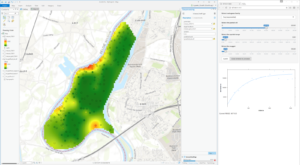
ArcGIS is the central tool to handle and derive geoinformation in many applications. However, the standard kriging capabilities only include a few covariance functions and hide the estimation and fit quality of the semivariogram to a large degree. R is less appealing for working with maps, but features a variety of statistical, i.e. geostatistical, extensions. In this showcase, we exploit the semivariogram modeling and kriging capabilities of the gstat R package. In order to give the user visual control over the estimation procedure and the model selection, we use the Shiny framework to realize an interactive graphical user-interface for the semivariogram fitting step. This tool hides the entire R implementation from the user, but delivers a good deal of the geostatistical power to perform kriging.more >