
The MariData project was recently launched to improve the energy efficiency of ship operations and to reduce emissions. Fuel consumption regarding vessel traffic is affected by many factors, namely, the main and auxiliary engines, the propulsion system, ship hull, propellers, seakeeping performance, as well as weather and sea conditions. In order to tackle these problems, we divide the task of building a weather routing system into subproblems and handle each subproblem separately. Finding the correlations between the speed of the vessel and weather conditions would lead to a better understanding of the weather conditions affecting fuel consumption, therefore, we obtained speed data of the ship’s Automatic Identification Systems (AIS), then retrieved weather and sea information for each data point using timestamp and geographic locations. The combination of these data sources enabled us to build a model to better understand the inherent relationships.
Vessel Traffic and AIS Data
The Bureau of Ocean Energy Management (BOEM) and the National Oceanic and Atmospheric Administration (NOAA) have worked jointly to provide some of the most important records from the U.S. Coast Guard’s national network of AIS data. This data is collected through an onboard navigation safety device that transmits and monitors the location, time and the state of the ship, such as draught, speed and heading. The publicly available data source consists of information, such as location, time, ship type, speed and length. The dataset has been extracted and prepared to help analysts process the data and derive products that improve the understanding of marine transportation patterns.
The data is available from 2009 until the end of 2020, filtered to one minute and available as zipped CSV or GDB (geodatabase) data formats. The data differs in time ranges, location ranges and formats. We provide a tabular separation to distinguish each of the differences for each year, as follows:

If data are partitioned into zones, files are available for each month by Universal Transverse Mercator (UTM) zone. Figure 1. illustrates the 20 zones covering the U.S. coastal waters.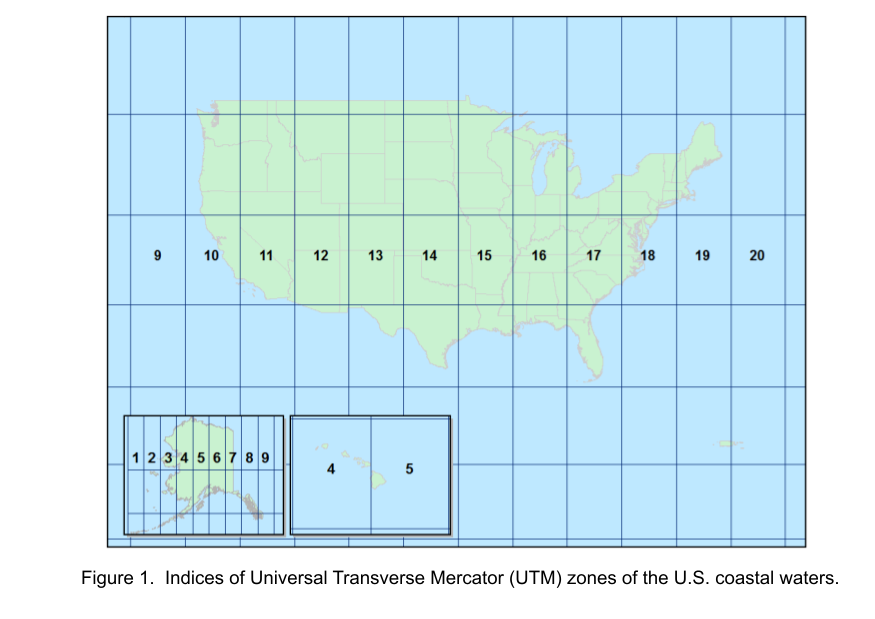
Weather and Sea Data
The Copernicus Marine Environment Monitoring Service (CMEMS), National Oceanic and Atmospheric Administration (NOAA) and the Research Data Archive (RDA) by the National Center for Atmospheric Researchers (NCAR) provide the weather models and environment data. This data is accessible via API services, which enables the retrieval of multi-dimensional grid structured data with specific geographical points and time intervals. 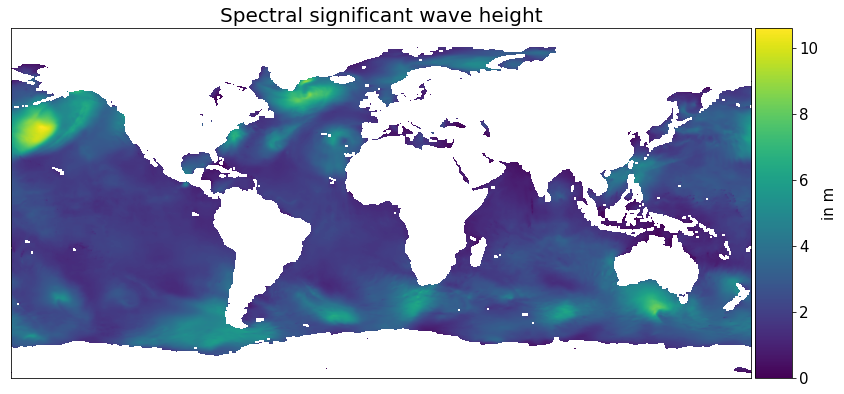
We selected weather products that are mostly relevant to sea state and weather routing systems, for instance, wave, wind and physical analysis and the global forecasting system (GFS). These consist of different variables regarding temperature, primary and secondary waves, wind information and sea water physical characteristics. In addition, some products are divided into near real time (NRT) products, which range from up to two years in the past until the present time, and historical products, also called Multi-Year (MY), which range from up to 30 years into the past. Each of these weather products has different spatial and temporal resolutions, time ranges and a method of data access. Therefore, we provide a tabular separation to distinguish each of the differences, as follows:
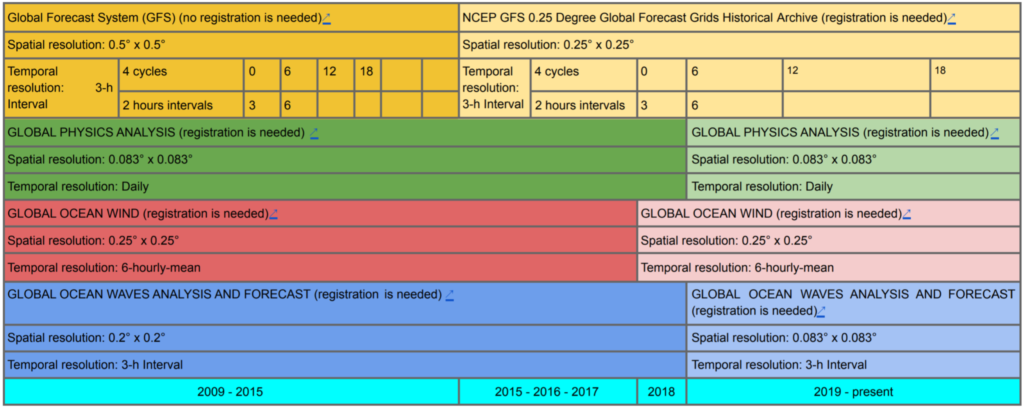
The access to CMEMS data is done through the motuclient library using login credentials, which eventually retrieve datasets as NetCDF4 files. For the RDA and NOAA data access, we use the thredds server to obtain grib2 files as NetCDF4.
Merging Ship’s Speed and Weather Data
We collected the data using the MariDataHarvest tool that we developed for the MariData project. It performs scraping of the AIS data, which consists of Speed Over Ground (SOG), Course Over Ground (COG), vessel type, the dimensions and the heading of the ship. In the next step, we appended the weather and environmental data to the AIS data at each geographical point and the Coordinated Universal Time (UTC) timestamp. According to the tabular separation of environmental and AIS data, the merged data can also be combined into one table to give an overview of the structure of the resulting dataset:

The weather data is multi-dimensional grid structured data, which does not necessarily align with the AIS locations or timestamps.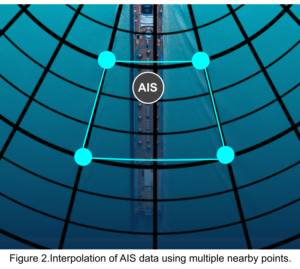 We convert the weather data into multi-dimensional data types using the xarray python library in order to perform indexing and interpolation. As illustrated in Figure 2., the position of the AIS signal is located between four different weather values. We obtain the values based on the surrounding points using multi-dimensional interpolation.
The Next Step
After merging and collecting a reasonable amount of data about ship’s speed and weather and sea conditions, we can use data analytics and machine learning to discover correlations about the relationships between weather and ship traffic. This provides a good starting point for a weather routing system. We will cover this in another post, so stay tuned.
Leave a Reply