Introduction
Hi everyone!
I’m Shashaank Srivastava, and I’m excited to be joining 52°North for Google Summer of Code 2026. This summer, I’ll be working on building a QGIS plugin for the Weather Routing Tool (WRT). This blog marks the beginning of my GSoC journey, where I’ll share progress updates, technical decisions, challenges, and learnings throughout the summer. As an introductory post, I’ll talk about the project, the ideas behind it, what I aim to achieve, and a little about myself.
Project Description
The 52°North Weather Routing Tool (WRT) is a framework for computing maritime routes while considering environmental conditions such as weather, water depth, and routing constraints. While the tool already provides powerful routing capabilities, the current workflow is largely configuration-driven, requiring users to manually prepare configuration files and external setup steps. For users working in geospatial environments, this creates several challenges:
- Routing parameters cannot be configured directly on a map.
- Weather datasets are difficult to inspect visually before execution.
- Results are not tightly integrated into GIS workflows.
- Configuration generation still requires manual effort.
My GSoC project aims to bridge this gap by developing a QGIS plugin for WRT, transforming the workflow from a manual configuration process into an interactive GUI-based experience.
Idea
The core idea is simple: Bring configuration, visualization, and routing workflows into a single intuitive QGIS environment.
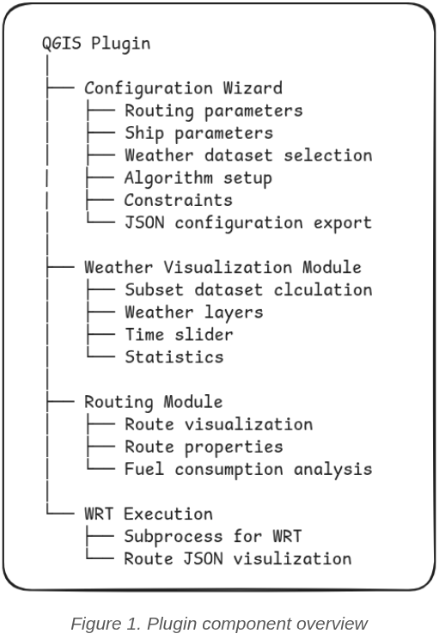
The plugin is designed as a modular system with four major components:
1. Configuration Wizard
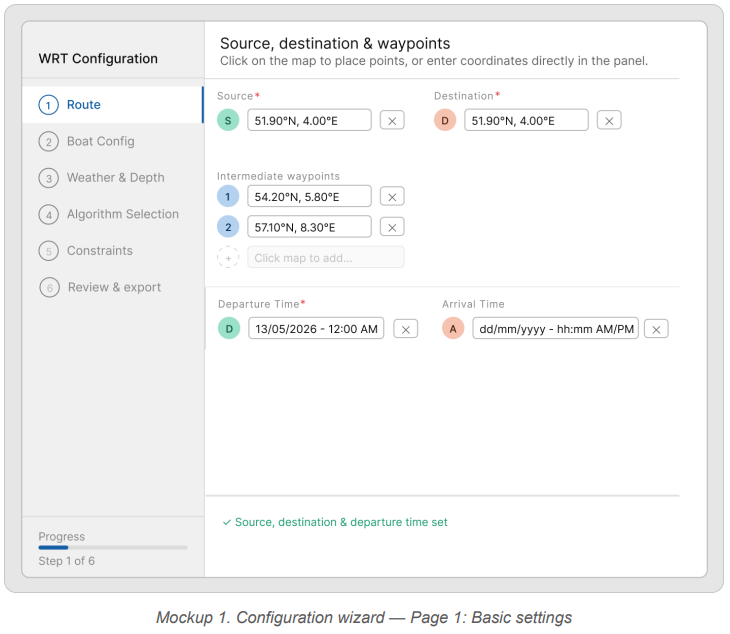
A guided, wizard-based interface will replace manual JSON configuration. Instead of editing files manually, users will configure routing through an intuitive workflow covering:
- Route setup (source, destination, and waypoints)
- Ship parameters
- Weather and depth data upload
- Algorithm and constraint selection
- Review and configuration export
A major focus is making configuration map-driven rather than technical, allowing users to place waypoints directly on the QGIS canvas.
2. Weather Data Visualization
The plugin will include a dockable weather visualization panel for exploring NetCDF weather datasets directly inside QGIS. Users will be able to:
- Inspect weather variables interactively
- Explore time-based data using sliders
- Visualize raster and vector layers
- Adjust rendering and styling
- Analyze spatial statistics within selected regions
This makes weather validation easier before running routing tasks.
3. Route Visualization
Instead of treating generated routes as static outputs, the plugin will visualize them directly inside QGIS as interactive map layers. Users will be able to inspect route properties, analyze metrics such as vessel speed or fuel-related information, and explore routing results spatially.
4. Streamlined WRT Execution (Optional)
As an optional extension, the plugin may support running the Weather Routing Tool directly from QGIS.To avoid dependency conflicts with QGIS’s Python environment, the plugin will manage an isolated Python setup, simplifying installation and reducing friction for users.
Project Goals
Through this project, I hope to achieve the following goals:
1. Make WRT More Accessible
I would like to reduce the complexity of the current workflow by replacing manual configuration with a guided, GUI-based experience.
2. Improve Visualization Workflows
I will provide intuitive ways to explore weather datasets and routing outputs directly inside QGIS, making analysis easier and more interactive.
3. Streamline the User Experience
I will build a plugin that integrates naturally into GIS workflows, reducing setup overhead and making the tool easier for both technical and non-technical users.
4. Learn and Contribute
I’m excited to deepen my understanding of
- QGIS plugin development
- PyQGIS and PyQt, Geospatial visualization systems
- Scientific geospatial formats like NetCDF and GeoJSON
while contributing something meaningful to the 52°North ecosystem.
About Me
Hi! I’m Shashaank Srivastava, a third-year undergraduate at IIIT Jabalpur and a passionate software developer with interests in geospatial systems, AI, and interactive software design. I enjoy building systems that combine real-world problem solving with intuitive user experiences. Over time, I’ve worked on projects spanning full-stack development, AI-driven applications, and UAV-based geospatial workflows, which sparked my interest in QGIS and spatial visualization.
I am looking forward to sharing progress updates in the coming weeks!
Find me on:
LinkedIn: https://www.linkedin.com/in/shashaank-srivastava-852933289
GitHub: https://github.com/ShashaankS
Leave a Reply