This week, we will have one blog post by each of this year’s Google Summer of Code students presenting their project and themselves. After Khalid posted his blog, it is now Patrick’s turn!
This is the first blog post for the Google Summer of Code 2013 project being organized by 52°North and me with the goal of adding support for seismic data in the existing applications Sensor Observation Service (SOS) and Sensor Web (SWE). These applications currently function in unison to provide a user with sensor data; to display both the sensor location on a map, as well as the corresponding graphical information the user asks for. The data formats that are supported right now are based on climate and hydrology sensing and the applications have so far existed for the purpose of analyzing this sort of observation information. This project’s outcome can be used as an observation tool for seismologists wishing to find a seismometer on a map, and analyze its plotted data with location in mind.
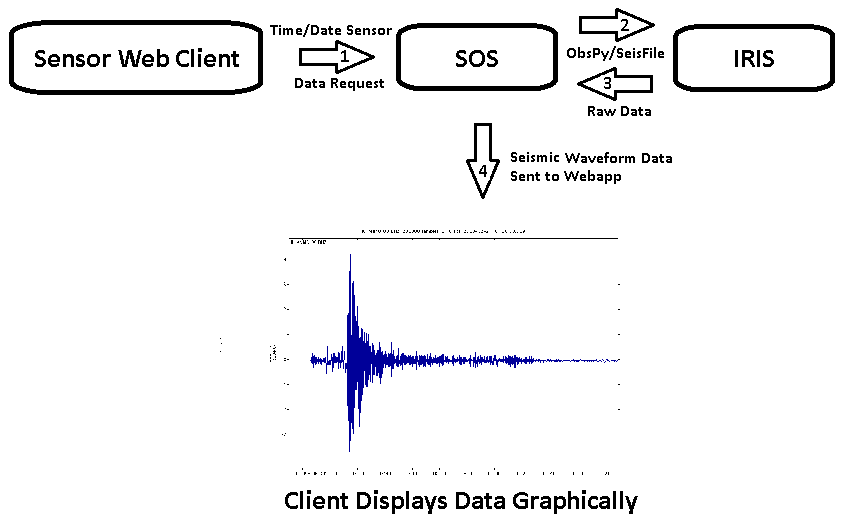
As of now, the first main stage of work is beginning, which is to plan and implement a data flow path through SOS. This will involve choosing the best data format for the job, as well as the best querying script. Seismic data querying frameworks that may be used are ObsPy, and SeisFile, which will pull data from IRIS, and/or similar information repositories. The first area of development will be towards a basic SOS encoder. The seismic time series data, once working correctly, will follow the same data path as the existing encoder for WaterML and other current SOS data types. It should be able to make basic query requests from an SOS server or servlet, and return seismic data files to the user. A figure describing the general data flow for the project as a whole is shown below. For information regarding the context of using seismic data to analyze the earth, refer to the Seismology wiki page.
Having more knowledge in seismology than climatology, I personally thought that the existing SOS/SWE framework would work wonderfully with earthquake data as well. In some of my classes I have had to use ObsPy code to query and analyze seismic sensor data. The experience helped me realize the usefulness a visual layout would have for this purpose, as a geologist would be able to see exactly where on the planet data was coming from as well as analyze the data itself. For more information on this project, please visit the project wiki page.
My name is Patrick Noble. I am a 3rd year Computer Engineering undergraduate student at Cal Poly San Luis Obispo. For any personal questions, please feel free to contact me at .

Leave a Reply