In the past ILWIS had limited 3D capabilities. One could make a GeoRef3D which generated a 3D image (with a DTM) but it was cumbersome to use and quite slow. One of the goals of the 3.8 was upgrading these capabilities to something usefull.
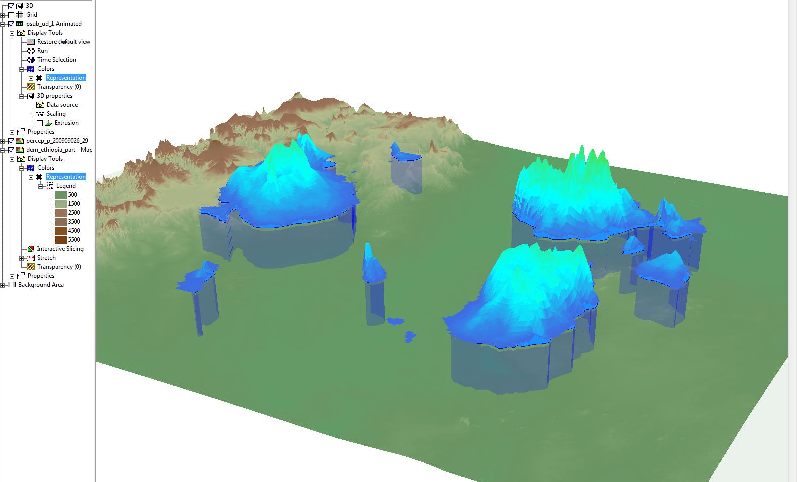
In line with the design goals as mentioned in a previous blog, the idea was to create a 3D enviroment that could be helpfull for visual analysis. When one looks at a rendering of a map (2D), basically you explore the relations between the spatial locations and one or more attributes that are related to that spatial location. The most used is of course some color representing the value of an attribute. There are several schemes to enhance this ( number of attributea) in 2D but they often become a bit confusing.
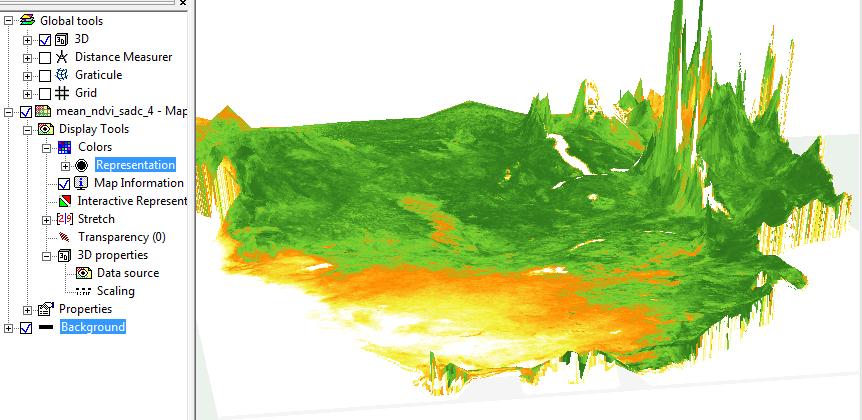
If we use 3D space we can visualize the relation between spatial (X, Y) and two attributes in a simple way. We simply map the Z dimension onto a numerical attribute and still use different color ( or other form of representation) for the other attribute. This was for me the corner stone when designing 3D. So for example, the picture below shows the NDVI for a certain period (color) and the average precipitation (Z dimension) of the same period for the southern half of Africa.
So, how do we do those things? If you look at the Layer view at the left, you may notice two things that are different from the regular situation. First of all, in “global tools”, the 3D mark is checked. If checked the whole view shifts to 3D mode. But as the view has no default Z information, its just a flat map viewed in 3D. To add the Z information we activate the 3D properties tool ( context menu, right mouse button, on “Display tools”). Now we have a new tool in the tree, 3D Properties. To add a “real” Z value, double click on “Data Source”. We get now a small form with a few options
- Self. This means the Z information comes from the values of the map it self. Usefull for DTM’s and such
- Rastermap. Select another value rastermap of the same geographic area. The values of identical coordinates on the source map will be used as Z information on the 3D view.
- Maplist, only relevant for 3D animations. Every map in the animation is linked to a map in the maplist
- Attribute column. The Z information comes from an attribute column of the map.


Leave a Reply