The second Beta of ILWIS 3.8 is done and on the download site!
So what can you expect of this Beta? Well, a number of things that were not available in the first beta are now available, such as color composite and some editors. Some new things, things that were not possible in 3.7 have been included. For example Hovmoller diagrams and base maps (see below).
Some things didn’t make it (yet), like the stereo pair and the sample set editor. The stereo pair is for a large part done and a first version will be done this week but I didn’t want to wait for it. The sample set editor is still in the start phase.
A few of the new things are:
Basemaps
Often it is convenient to have some data-sets always available; for example a boundary map of a certain region to make orientation easier. To facilitate this the “basemaps” have been introduced. Basically it is the same as “system” objects for ILWIS but this time for maps. They reside in the basemaps folder of the system folder of ILWIS. Any map in there will show up as base map when you want to add new layers. The add layers form has been adjusted to reflect this and in the Catalog there is a new menu entry under the “Show data” item (also in the context menu of the catalog). By default I have included three data sets to illustrate how this option works.
Color composites
Dynamic color composites were not possible in 3.8 beta 1. The editor for this has been fully rewritten and is now included in the 3.8 beta-2. It follows the same ideas as the other display tools. Double clicking on the nodes of the tree brings forth forms to change the properties of the tool (in this case stretch on the values and order of the bands). We didnt include HSI color composites yet as we were a bit unsure if this option was used often but we can include it.
Full screen mode
The content of the map window can now be shown in fullscreen mode. So no Layer tree view, no menu, only the map. There still a little bug(they are visible) with two scrollbars but that will be removed.
Hovmoller diagrams
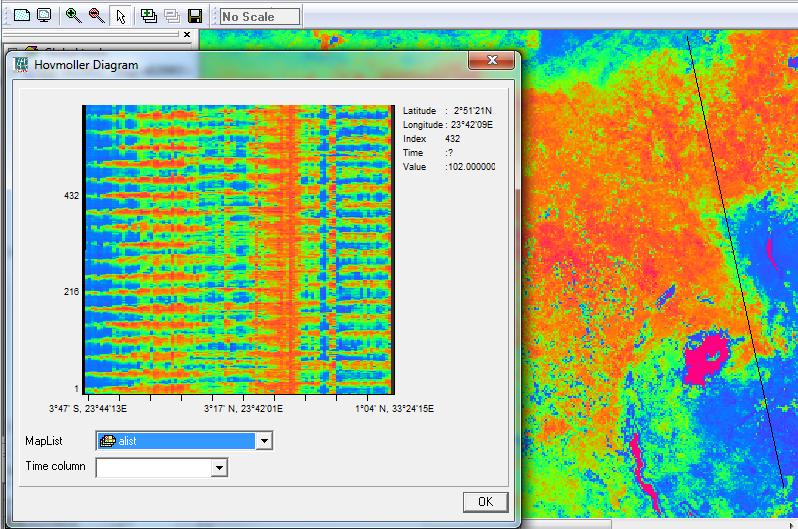
A Hovmöller diagram is a commonly used way of plotting meteorological data to highlight the role of regular occuring events (“waves”). They are not limited to meteorological events though. In ILWIS the content of a maplist (over a longer period) is plotted on a tracking line on the map leading to diagrams like this:
This is the result of a maplist of 600 maps that cover the ndvi vallues of a part of Africa between 1982 and 1999.
Of course a number of bugs have been removed and the UI has been cleaned up at a number of places. I think this will be the last beta. The next version will be the release version.


Dear Martin
I´ve been an ILWIS user for a long time, mainly because its analysis tools match very well to my research work in conservation. As an academic from an undeveloped country, I urge my students to use this open source free program. I agree that this is not a cartographic program and the Layouts routine could be greatly improved, but there isn´t a strict boundary between cartography and analysis scenarios, at the end you need to create maps in order to show your results to non experts decision policy takers. Please include printing capabilities in your 3.8 version. I´m sure I´m taking for hundreds of low budget resource users from the undeveloped countries that can´t afford expensive software.
Sincerely
Hugo Riemann
As with all these things it’s a matter of priorities. When designing the schedule for the 3.8 some choices had to be made what we can do with the given time. The time I can spend in the project is not infinite. Creating a decent printing system is not an easy task as the paper (and its sizes) is quite a different beast than the screen.
As it now as is, ILWIS has good copy option (300 dpi, could enhance that to 600 dpi but then the clipboard gets very full), this you can use in lets say a word processor or other package to finalize the product you want to print. The copy routine is a WYSIWYG copy. Everything in the current (zoomed) map window is copied ‘as-is’ to the clipboard.
This frees from the burden of having to deal with all kinds of printer and paper issues (and yes there those are on a programming level) and I don’t have to implement all kind of, what are basically text processor and/or image rendering functionalities, inside a GIS. To be honest, I still think its a very defensible trade-off.