With the 3.8 we tried to make the response of the the renderings to the users actions as direct as possible ( of course, where reasonable and technically feasible). With this I mean that if a user changes lets say the transparency of a layer, the transparency must change on the fly and not after pressing some apply button. The idea is to give immediate feedback and limmit the number of user interface actions a user needs to do when setting up a rendering. In this blog entry I want to show you a few of these.
An example : Interactive representation
In a previous blog entry I described how a number of the ideas for the ILWIS 3.8 mapwindow came from the ANIMVIS prototype. One of the important parts was there to be able to adapt the coloring of maps during an animation to be able to dynamically single out important areas on the maps with distinct value ranges. In fact a form of interactive slicing. When desigining and testing the required interface for ILWIS (ANIMVIS was a stand alone, non ILWIS prototype) it quickly grew in something more. Usefull not only for animations but also for single value maps and because I allowed gradual coloring of the slicing bands it was more than just a slicing tool. It had become an interactive representation.
So how does it work?
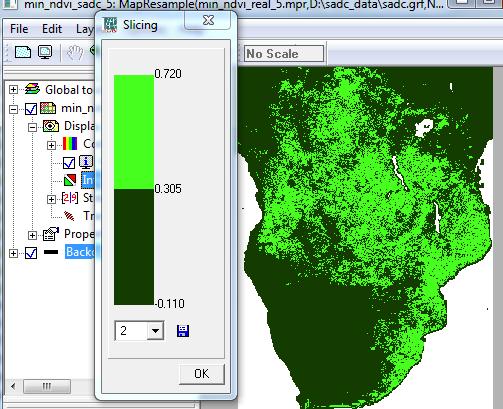
The default looks aren’t that impressive. It just divides the map into two equal areas. One contains all the values above half of the value range, the other the rest. A basic slicing of the map. You may divide it into more areas by selecting different numbers in the combobox below. The fun begins when you click in the rectangle with the colors on the form on the dividing line between two areas. A thin red line forms and when you slowly drag that line (keep the left mouse button down) up or down you see the areas on the map change with it. Below is an example of that could look like
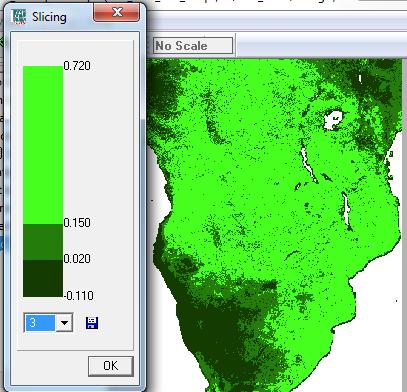
I made three areas and divided into such a way that I get three areas that are divided into ranges I find usefull to be able to identify specific areas that match these criteria. Infact if have a form of interactive slicing.
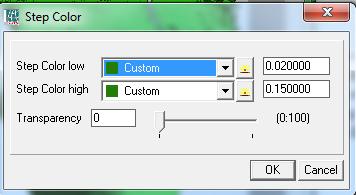
All this is great of course but it’s rather, ehm, green and well the moving of the boundaries is great for quickly locating key areas but it is not very precise. Fortunately there is a solution for this. When double clicking on an area (on the form, not the map), you get a form that gives you more control
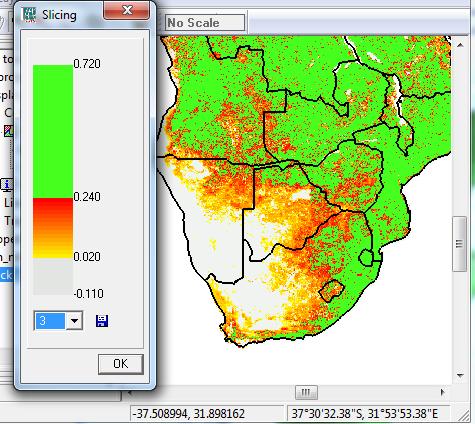
with it you can, within one band change the low and high color, exactly define the boundaries and setting the transparency for that layer. Combining those properties I made the rendering below. 3 bands, one with a flat color, one with a gradual color and one with a flat color but 90% transparent.
with this method you can quickly visualy mark your areas which you find interesting while leaving the rest of the map simple (flat colored) to avoid visual cluttering. It becomes realy interesting when this used in an animation but I leave that up to the reader to try out :).
Example 2 : Track profile
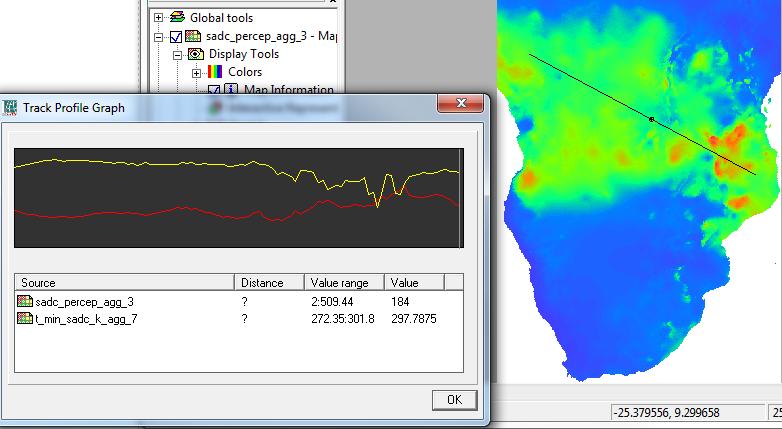
The profile tracker. Profile trackers are of course not new but I added a few small things to it. The profile tracker is not by default enabled and you have to call it forth from the context menu on the display options node in the Layer treeview. After that you can click anywhere on the map and draw a line to any other location on the map. When you click again, the line is finished and the profile shown
The graph shows now the profile along the line. As you can see there are two line here. That is because I added a second data source for this profile. You can do this by double clicking on the node in the Layer treeview. Another small thing is that if you click on the graph. The exact value of that location will be shown in the list below it and a marker will appear in the map (rather tiny marker, maybe I will make it bigger). Last small thing is that if you press control when marking the end of the line it will continue the line until you end it. This way you can see the profile over a multi legged line.
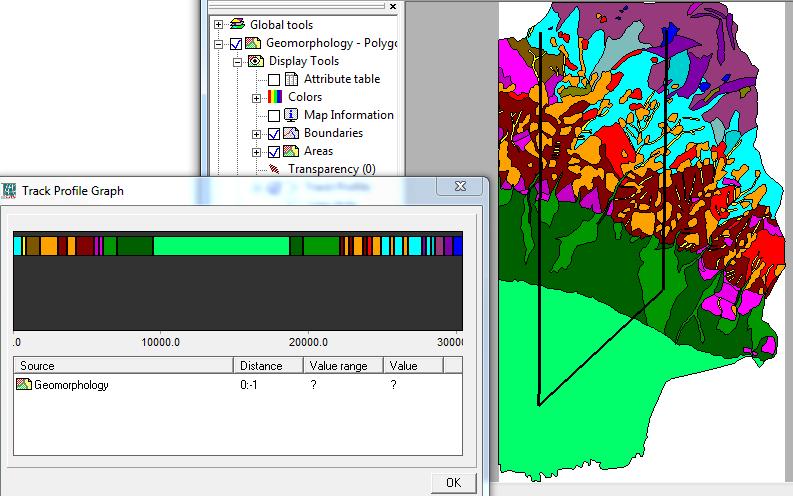
One last remark. The track profile works just fine with class maps
A multi leg profile over a class map ( I increased the line thickness for more contrast).
You should see the track profile in an animation, there the line moves in sync with animation.
Other tools that work interactively are : stretching, transparency, colorcomposite and few others.
I tried importing a table in ILWIS 3.3 Academic and 3.7. In 3.3, it could not detect the xls format, and in 3.7 it could not respond.
What should I do?