Designing and implementing a research data infrastructure to assist scientists from the aquatic realm to restore healthy oceans, rivers, and lakes
I was pretty sure that the statement “Finland is a heavy metal country” was just a cliché. But it’s not. You can walk through a university building and someone plays “Nothing Else Matters” by Metallica on an acoustic guitar. But you can also enter the local shopping center on the same day and see a group of people performing Lordi’s “Hard Rock Hallelujah”. Fiction? That’s exactly what happened to me on my trip to Oulu for the AquaINFRA Use Case Meeting. Anyway, back to business.
In short, what is AquaINFRA about? As I already described in a previous blog post, the main goal is to design and implement a research data infrastructure to assist scientists from the aquatic realm in restoring healthy oceans, rivers, and lakes. The infrastructure is made up of three key components:
- Data Discovery and Access Service (DDAS) is a federated metadata search service
- AquaINFRA Interaction Platform (AIP) is the central gateway and search user interface
- Virtual Research Environment (VRE) provides tools to analyze data
Several researchers in the project work on case studies to demonstrate the benefits of FAIR and open data organized in such an infrastructure. To do so, they develop computational workflows that analyze publicly available FAIR research data. An important goal of the project is to make the data and analysis workflows available via the AquaINFRA infrastructure.
Once a year, the researchers come together to present their latest use case achievements, discuss problems, and organize the next steps. Their plans for integrating the analysis workflows into the research data infrastructure have also been an agenda item at each presentation. In the following post, I will give an overview of the current state of the research data infrastructure, focusing on 52°North’s key contributions to the AquaINFRA project: The AIP and VRE. If you want to learn more about the DDAS, just check AquaINFRA’s website and the deliverables.
The AquaINFRA research data infrastructure aims to help users…
- Discover and access FAIR research outputs
- Analyze and share digital research objects
- Enhance the reusability of AquaINFRA products
- Experiment with existing and develop custom data analysis workflows
- Transform how research outputs are created and shared
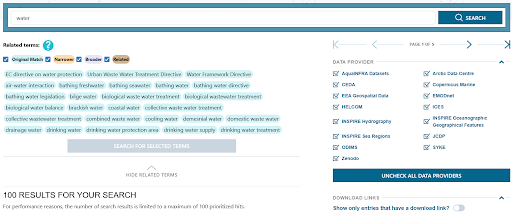
Let’s start with number one: discover and access FAIR research outputs. As we understand it, research outputs consist of existing, more or less analysis-ready data as well as code, services, and workflows. To support the discovery of FAIR research outputs, we developed a search user interface (Figure 1) using Open Pioneer Trails based on the DDAS. The search UI has the familiar keyword-based search field at the top but sometimes it can be challenging to find the right search terms. Thanks to Pekka Latvala’s ontology-based feature, users can choose from a range of related terms to refine their query. In addition, users can select from a set of data providers (e.g. EMOdnet, HELCOM) to specify their query. We learned that the metadata coming from the data providers often doesn’t include a link to download the data. For this reason, we implemented a toggle that allows users to filter the search results to those that contain a download link.
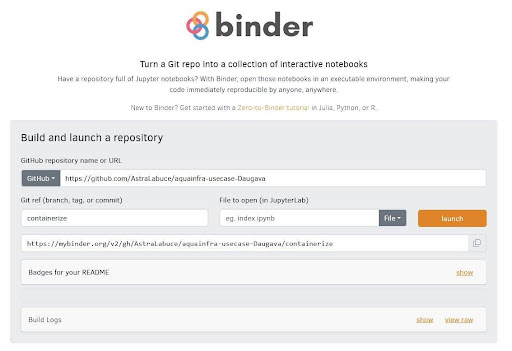
The second item is analyze and share digital research objects. For this we need a solution to share reproducible code plus the computational environment in addition to the data. Binder can help to achieve these objectives. Let’s say we have a GitHub repository including, for example, python and R files that analyze some data. If we add some configuration files specifying the computational environment (runtime + libraries + library versions) to the repository, we can use Binder. Binder is a web application that takes the URL to a GitHub repository and re-creates the computational environment (Figure 2). As a result, users receive a URL that they can easily share and open in a browser. This opens an RStudio or Jupyter lab environment where they can start working with the source code right away. The runtime and the libraries are installed. No local installation is necessary.
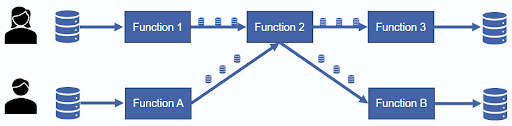
Next! We should enhance the reusability of AquaINFRA products. Analysis scripts can become huge and reusing parts of them is challenging. So, we decided to split the scripts into independent functions, each performing one specific task, such as importing, (pre-)processing, analyzing, or visualizing data. Those functions follow the input-processing-output logic and are self-contained. Ideally, we would achieve something like what is shown in Figure 3. Person A has a workflow composed of input data, three functions that run on the data, and some output. Person B working on a similar analysis can simply reuse function 2 from Person A’s analysis and doesn’t need to develop it from scratch.
The functions are containerized using Docker and made available via the web as OGC API Processes, together with the computational environment specified in the repository above. As a result, we have an executable, reproducible analysis with reusable functions. Other users can now write their analysis code and reuse one of the functions by requesting the corresponding OGC API Process. Check our Pygeoapi server for a list of currently available processes from the AquaINFRA project: https://aquainfra.ogc.igb-berlin.de/pygeoapi/processes?f=html
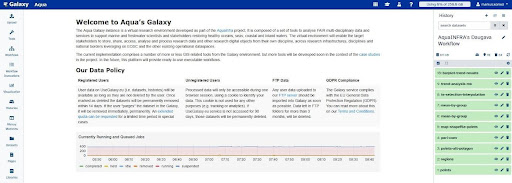
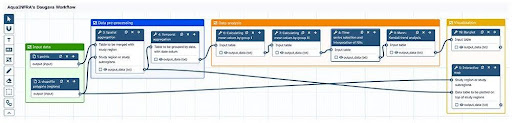
What else? Ah, users should be able to experiment with existing and develop custom data analysis workflows. For this task, we use the Galaxy Platform (Figure 4), an open-source web application providing a workflows canvas for creating readily-sharable workflows (more on Galaxy in the context of AquaINFRA? Go Here!). We wrapped the OGC API Processes as Galaxy tools so that the processes can be chained to workflows using the Galaxy canvas (Figure 5). Hence, Galaxy acts as an orchestrator when executing functions, but the calculations still run on the Pygeoapi server.
These three components – Binder, Pygeoapi, and Galaxy – form the Virtual Research Environment of the AquaINFRA Research Data Infrastructure.
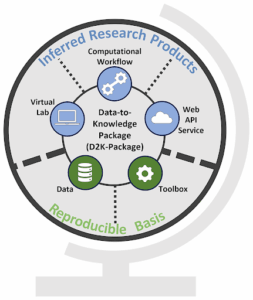
Finally, the infrastructure aims to transform how research outputs are created and shared. Now it’s time to present the so-called Data-to-Knowledge Package (D2K-Package). The D2K-Package (Figure 6) is a collection of links to the research components mentioned so far. We have a reproducible basis composed of the data, the functions in a toolbox, and the computational environment. Once we have that basis, we can infer all these wonderful research outputs, such as Binder as the virtual lab, OGC API Processes as the web API, and Galaxy workflows.
The D2K-Package is a metadata file containing the links to these components and based on this file we can create some nice user interfaces that show all relevant components on one page (Figure 7).
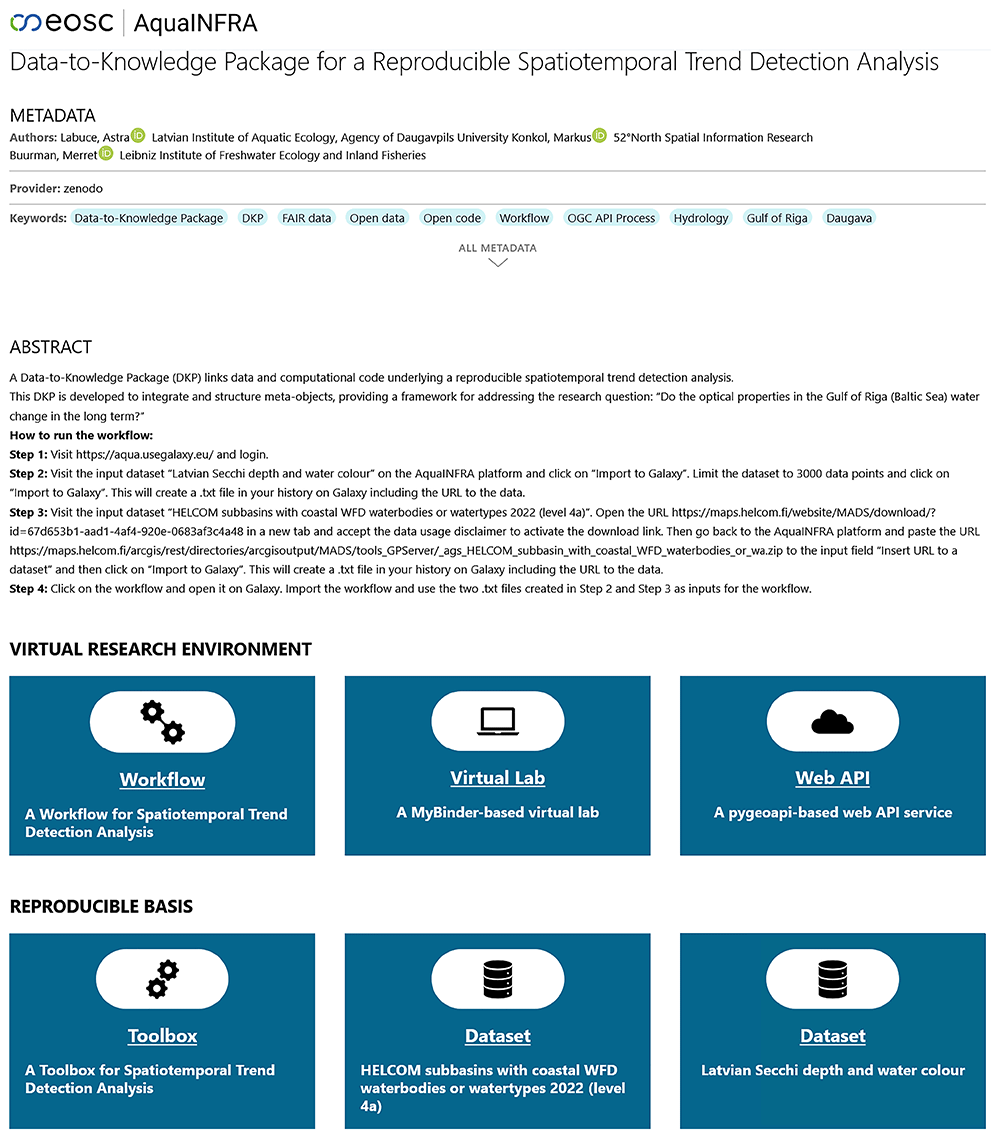
Curious? Go here and try it now! If you want to learn more about the D2K-Package, check our preprint that is currently under review: “Encouraging reusability of computational research through Data-to-Knowledge Packages – A hydrological use case”.
That’s it. Thanks for your attention. For me it’s time to jump into my Lederhosen, drink a beer, and eat a Bratwurst…just a (German) cliché ;).
This project has received funding from the European Commission’s Horizon Europe Research and Innovation programme under grant agreement No 101094434. Project coordinator: Aalborg Universitet (AAU). The information and views of this website lie entirely with the authors. The European Commission is not responsible for any use that may be made of the information it contains.
Leave a Reply