Introduction
Hello everyone!
The Google Summer of Code 2026 coding period is coming to an end, and with it, an exciting chapter of my journey with 52°North comes to a close. Over the past few months, I have been working on developing a QGIS plugin for the 52°North Weather Routing Tool (WRT). The primary goal of the project was to make the WRT workflow more accessible by transforming its configuration-heavy, manual process into an intuitive, GUI-driven workflow inside QGIS. This post marks the final chapter of my GSoC coding period. If you’d like to follow the journey from the beginning, you can also read my introductory blog post and midterm blog post.
At the beginning of GSoC, the problem seemed straightforward: build a QGIS plugin. But as I started working on it, I realized that the real challenge was not simply building individual features. It was understanding the user journey – how someone approaches the Weather Routing Tool, what makes the workflow difficult, and how software can remove those difficulties. By the end of the coding period, the major components planned within the scope of the project have been implemented, including the Configuration Wizard, Route Visualization, along with the work towards interactive Weather Visualization and the surrounding plugin infrastructure.
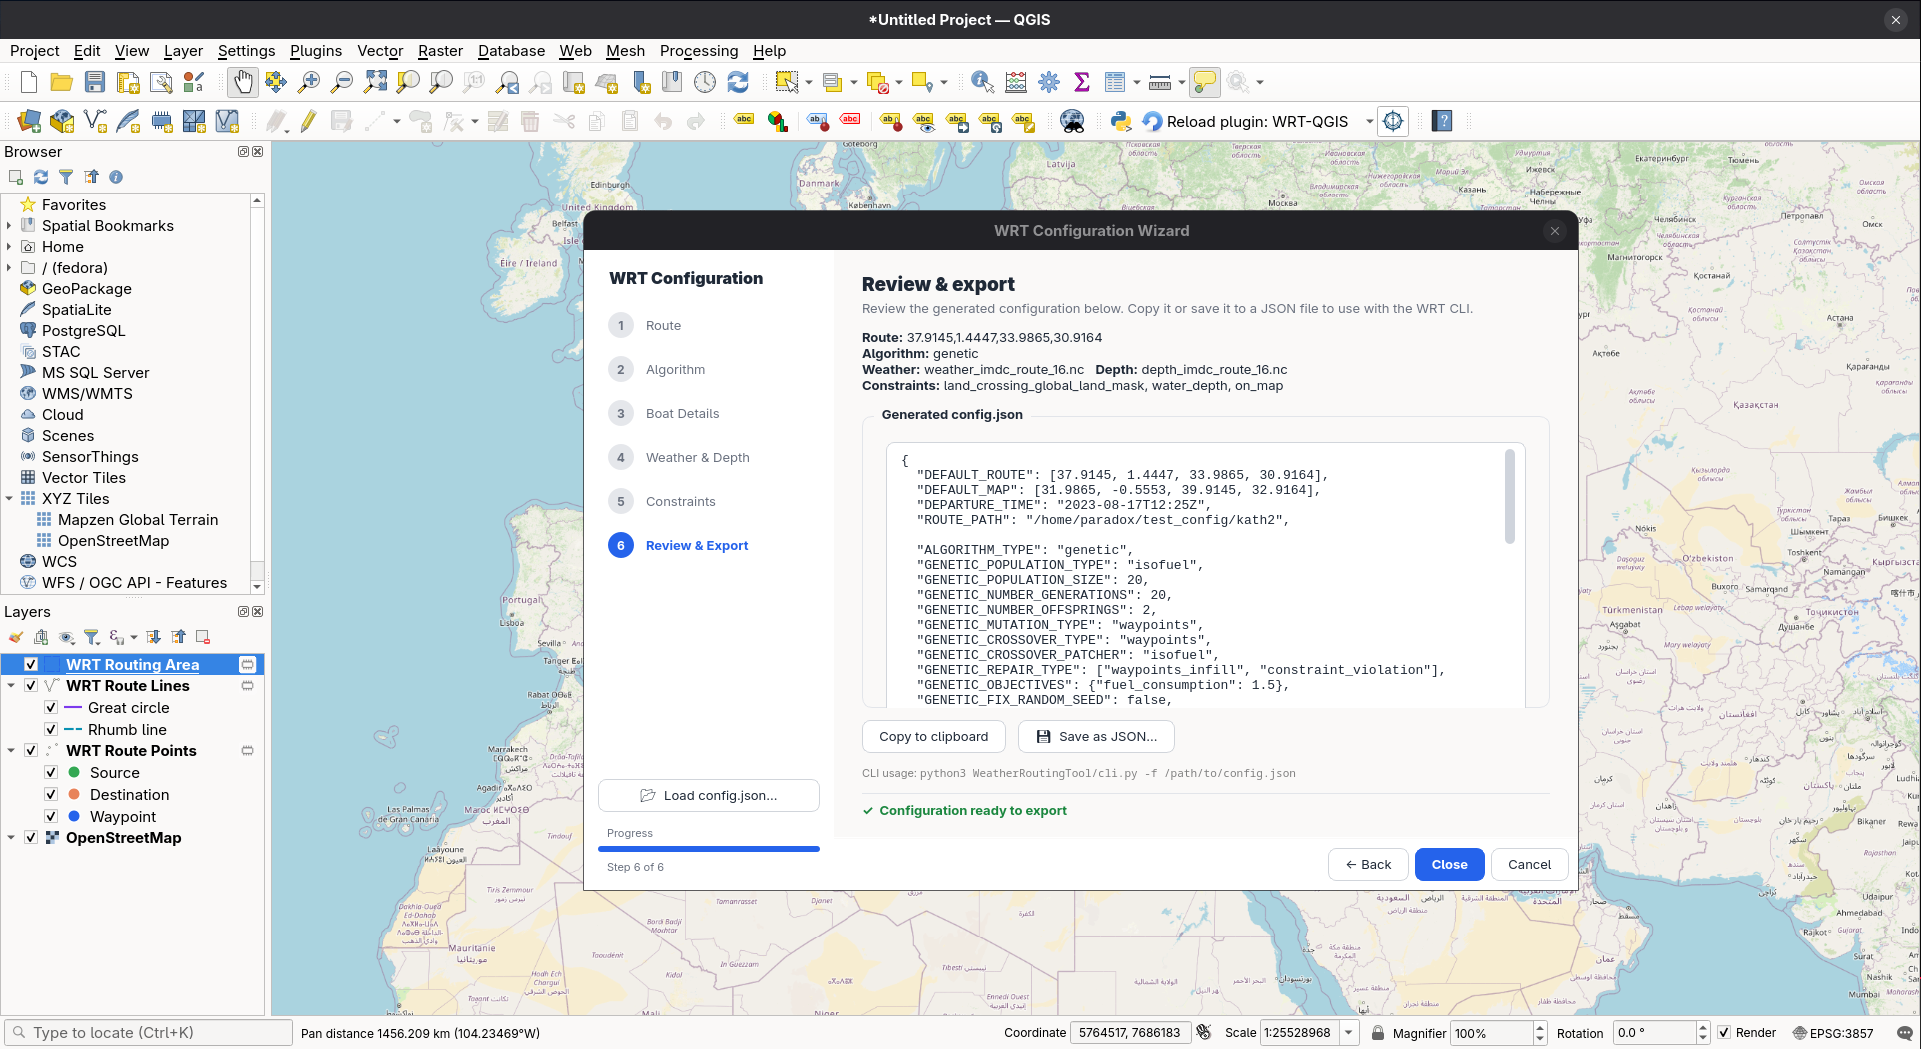
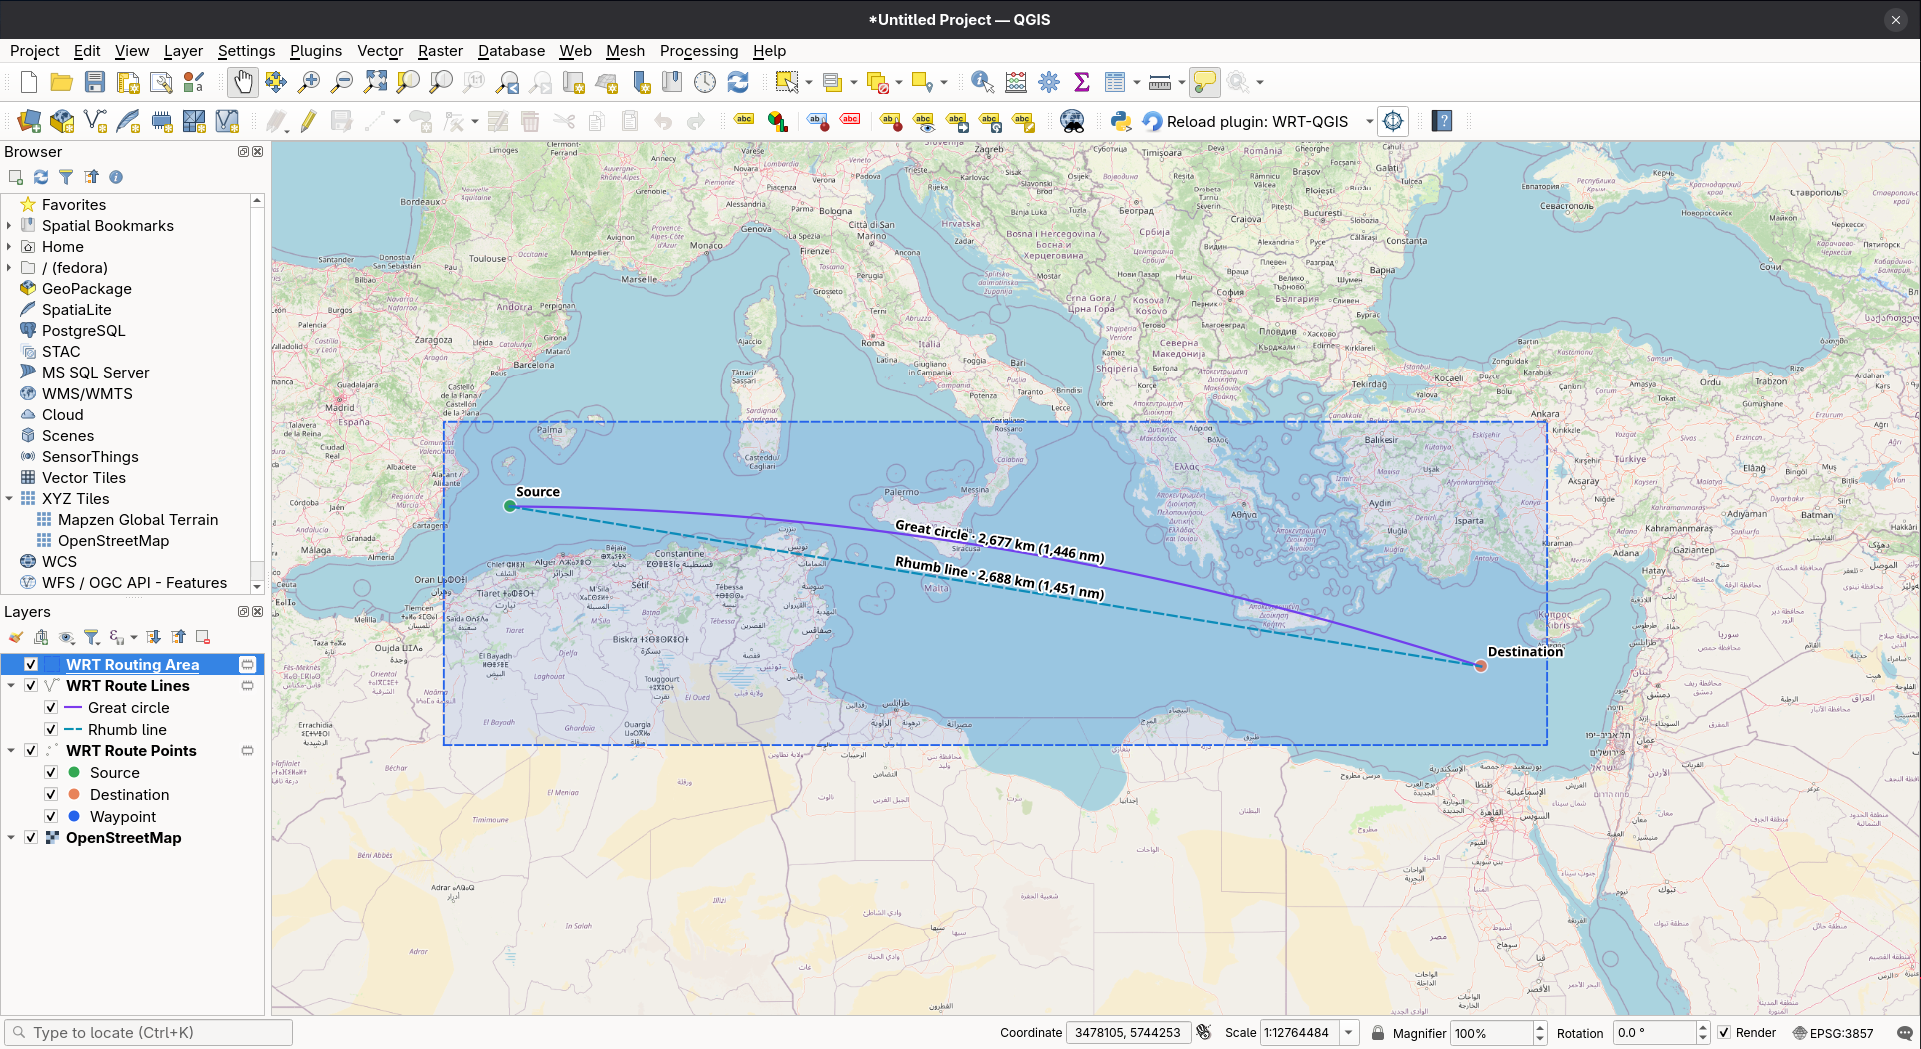
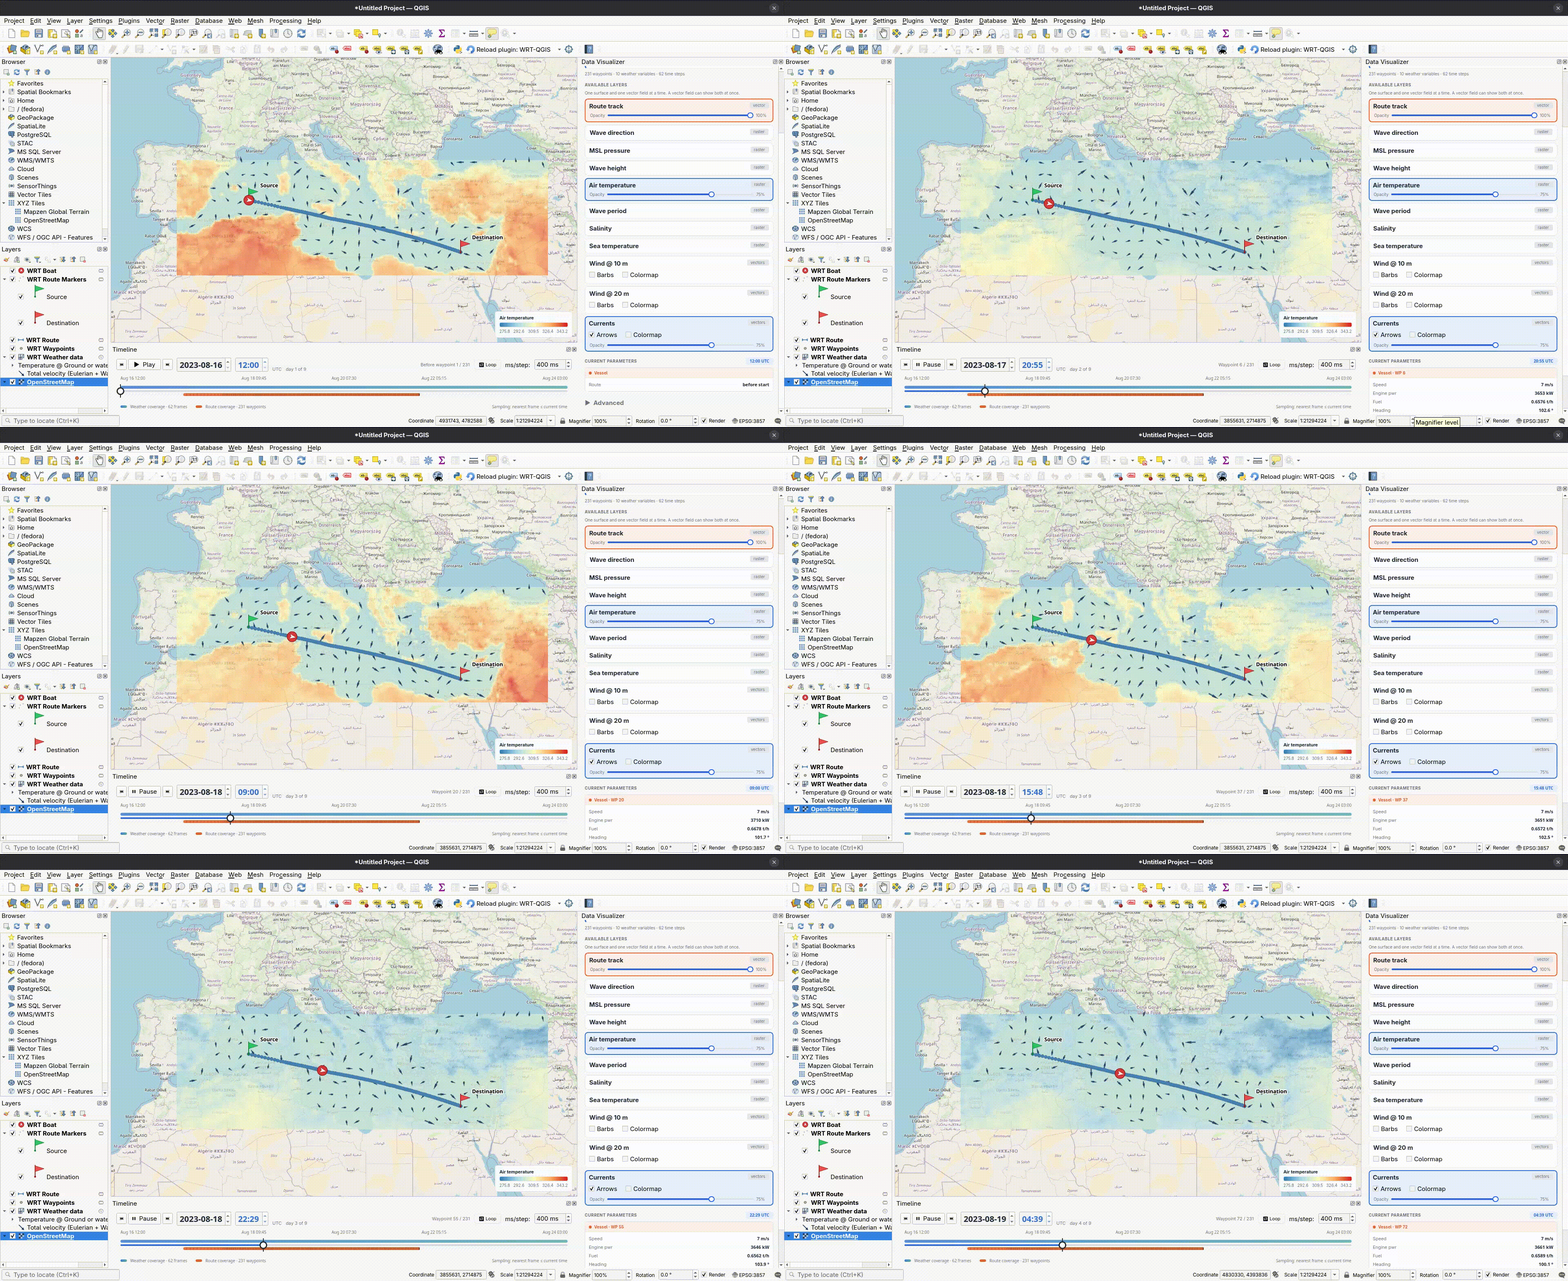
Screenshots from the built QGIS plugin are shown below in Figures 1a-c.
The Problem: A Powerful Tool with a Complex Workflow
The Weather Routing Tool provides powerful capabilities for computing maritime routes under environmental constraints. However, using it traditionally involves working with configuration files, preparing datasets, and understanding a number of parameters before a routing run can even begin. The challenge was therefore not about adding another routing algorithm. It was about asking: How can we make the existing capabilities of WRT easier to access and understand? The idea behind the plugin was to move from manual configuration to configuration through a GUI and ultimately towards Configure → Visualize → Analyze within the same QGIS environment.
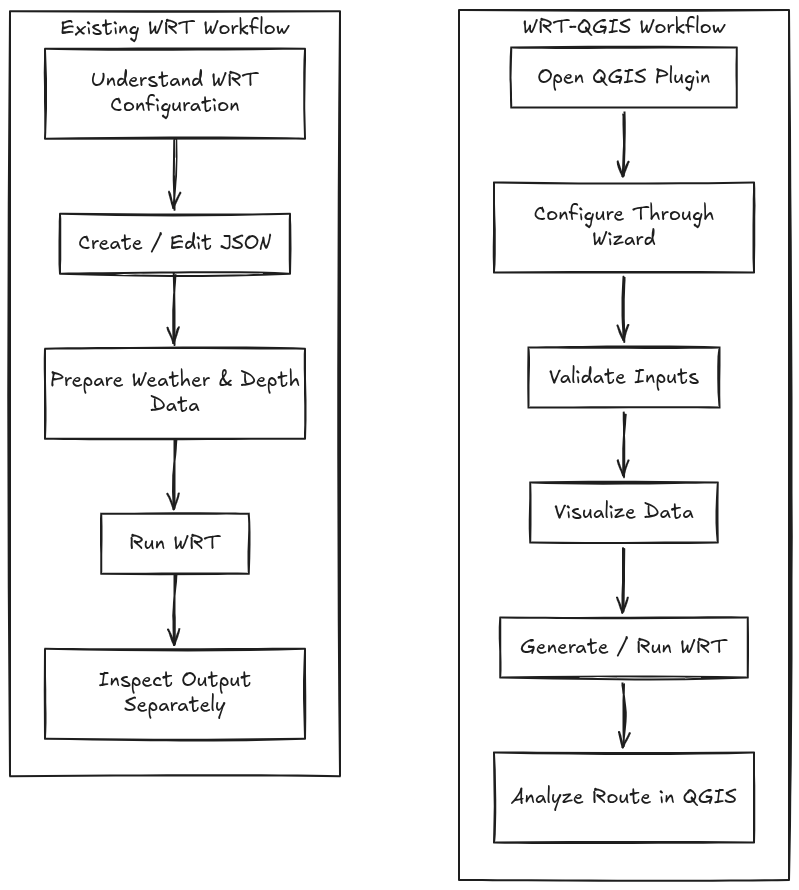
This shift in perspective became one of the most important ideas throughout the project.
From Configuration Files to a Configuration Wizard
One of the biggest parts of the project was the Configuration Wizard (see Figure 3). Instead of asking users to understand the structure of a WRT configuration file, the plugin guides them through a sequence of meaningful steps. The wizard breaks the configuration process into smaller, understandable decisions: Basic Settings → Algorithm →Ship Settings → Dataset → Constraints → Review & Export. Each page has a specific purpose, and information is presented when it becomes relevant.
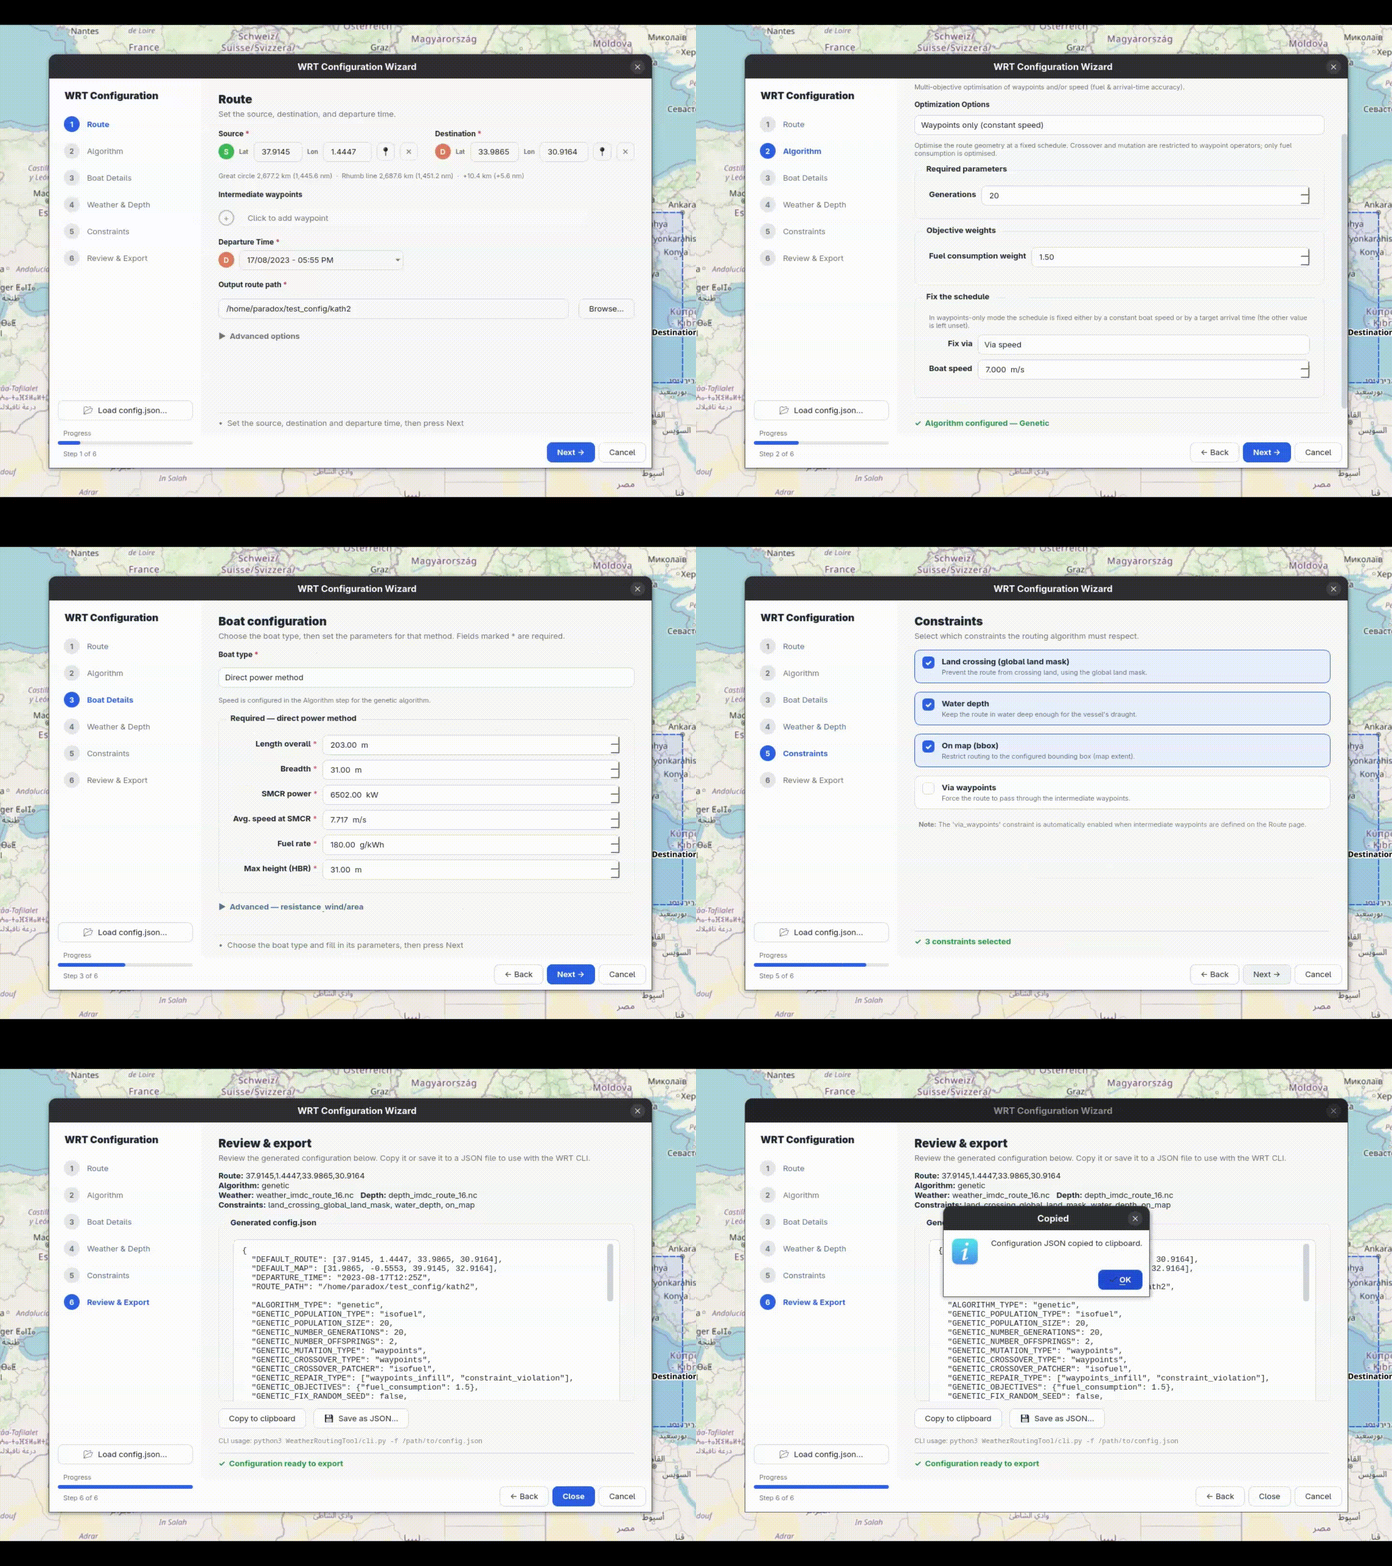
The goal was not simply to recreate every configuration parameter in a GUI. It was to ask: What does the user actually need to know at this point in the journey? This led to several design decisions around contextual fields, validation, optional parameters, map-based interactions, and the organization of advanced settings.
Making Route Configuration Map-Driven
One of the simplest but most important changes was moving geographic configuration onto the QGIS canvas (see Figure 4). Instead of manually entering coordinates for the source, destination, and waypoints, users can interact directly with the map.
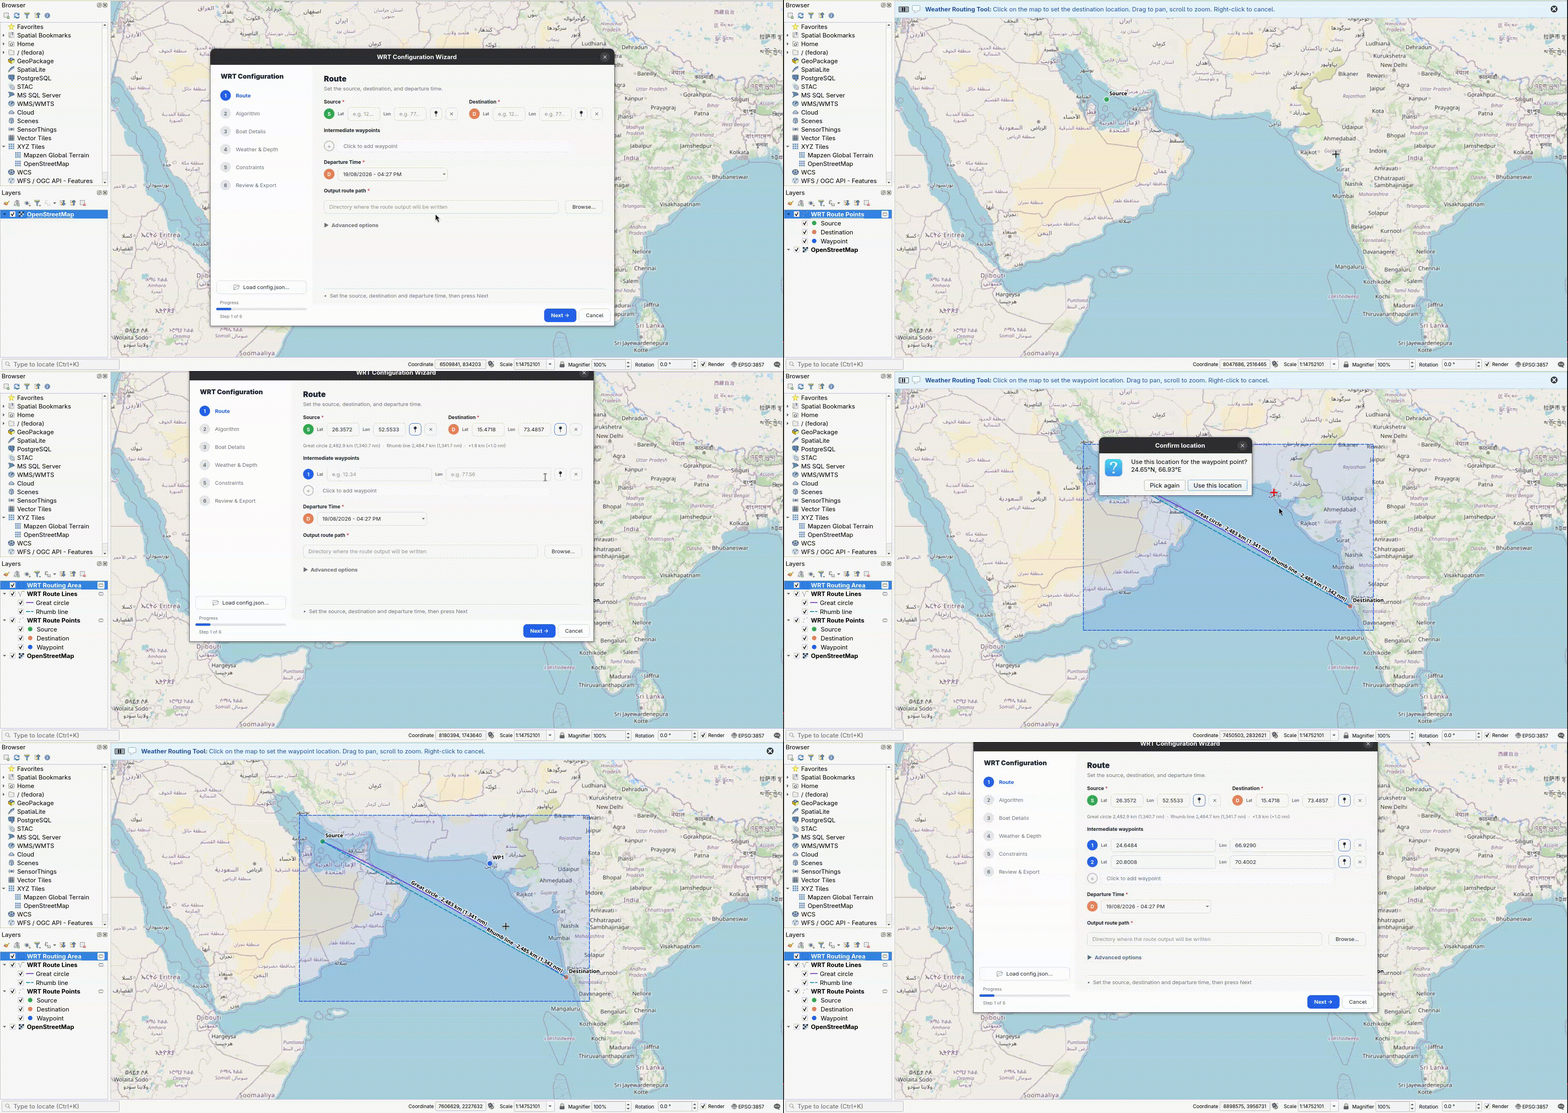
This makes the configuration process much closer to how users naturally think about a spatial problem. Rather than asking “What are the coordinates of my destination?” the interface allows the user to think “This is where I want the route to start, and this is where I want it to end.” That distinction may seem small, but it significantly changes the user experience.
Simplifying the Most Complex Part: Algorithm Configuration
One of the more challenging parts of the original configuration workflow was selecting and configuring the routing algorithm. Algorithm parameters can quickly become overwhelming, particularly when users need to understand which parameters are mandatory, which are optional, and which belong to a particular algorithm. The plugin addresses this by making the Algorithm page contextual (see Figure 5). When an algorithm is selected, the relevant parameters are presented to the user. Advanced configuration can remain available without making the initial interface unnecessarily complicated.
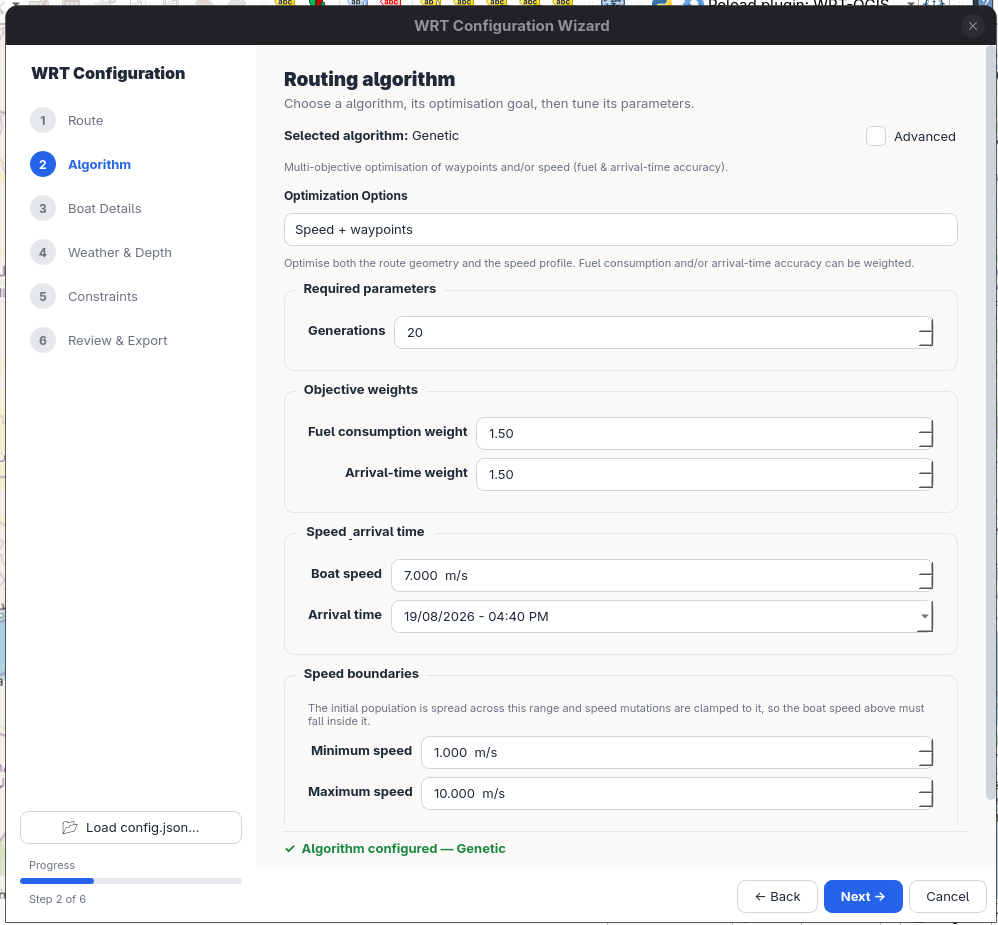
The intention was to maintain the power of WRT while reducing the cognitive load required to use it. This became a recurring design principle throughout the project: Don’t remove complexity from the underlying tool, hide unnecessary complexity from the user until it is needed.
Connecting Configuration with Visualization
Another important part of the project was making visualization a natural part of the workflow (see Figure 6). The Weather Routing Tool works with geospatial and environmental datasets, so users need ways to understand those datasets before and after routing. The QGIS environment provides a natural place for this because configuration and visualization can happen alongside the same map.
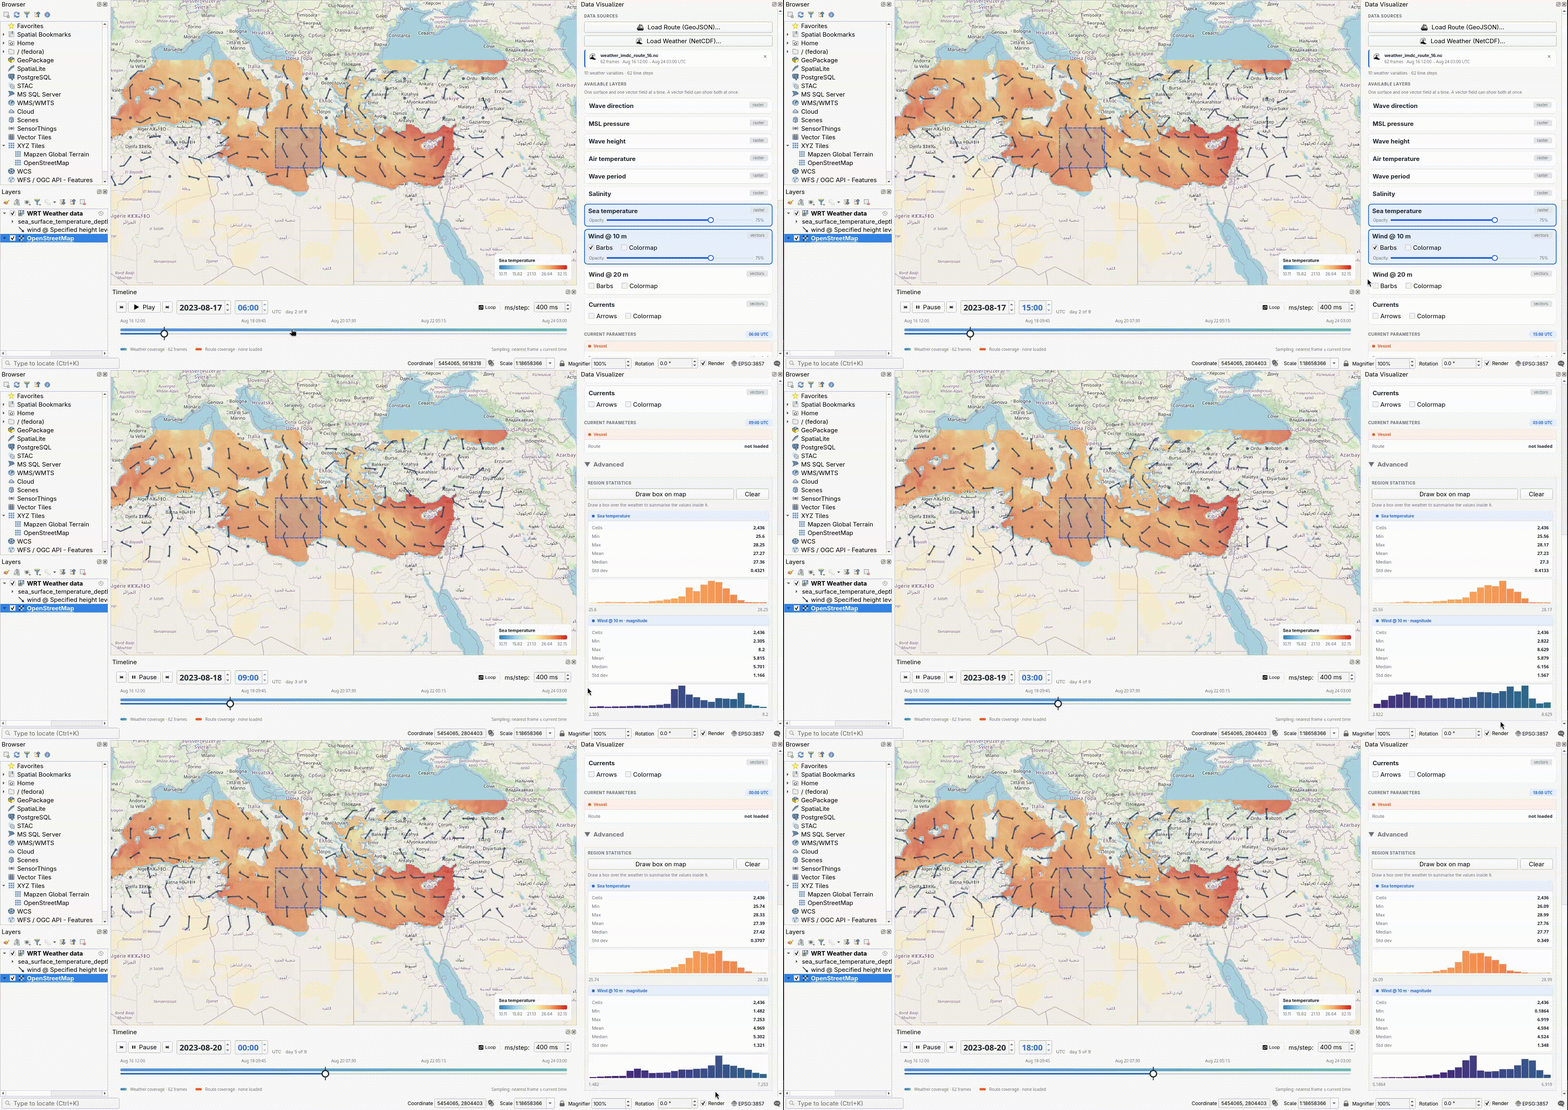
The weather visualization work also introduced me to the challenges of handling scientific geospatial datasets at a much deeper level. Working with NetCDF, multidimensional datasets, temporal dimensions, raster representations, and QGIS rendering required thinking beyond simply reading a file and displaying it.
Route Visualization
Another milestone of the project was Route Visualization (see Figure 7). Once a route has been generated, users should not have to leave their GIS environment to understand the result. The plugin therefore brings WRT route outputs directly into QGIS.
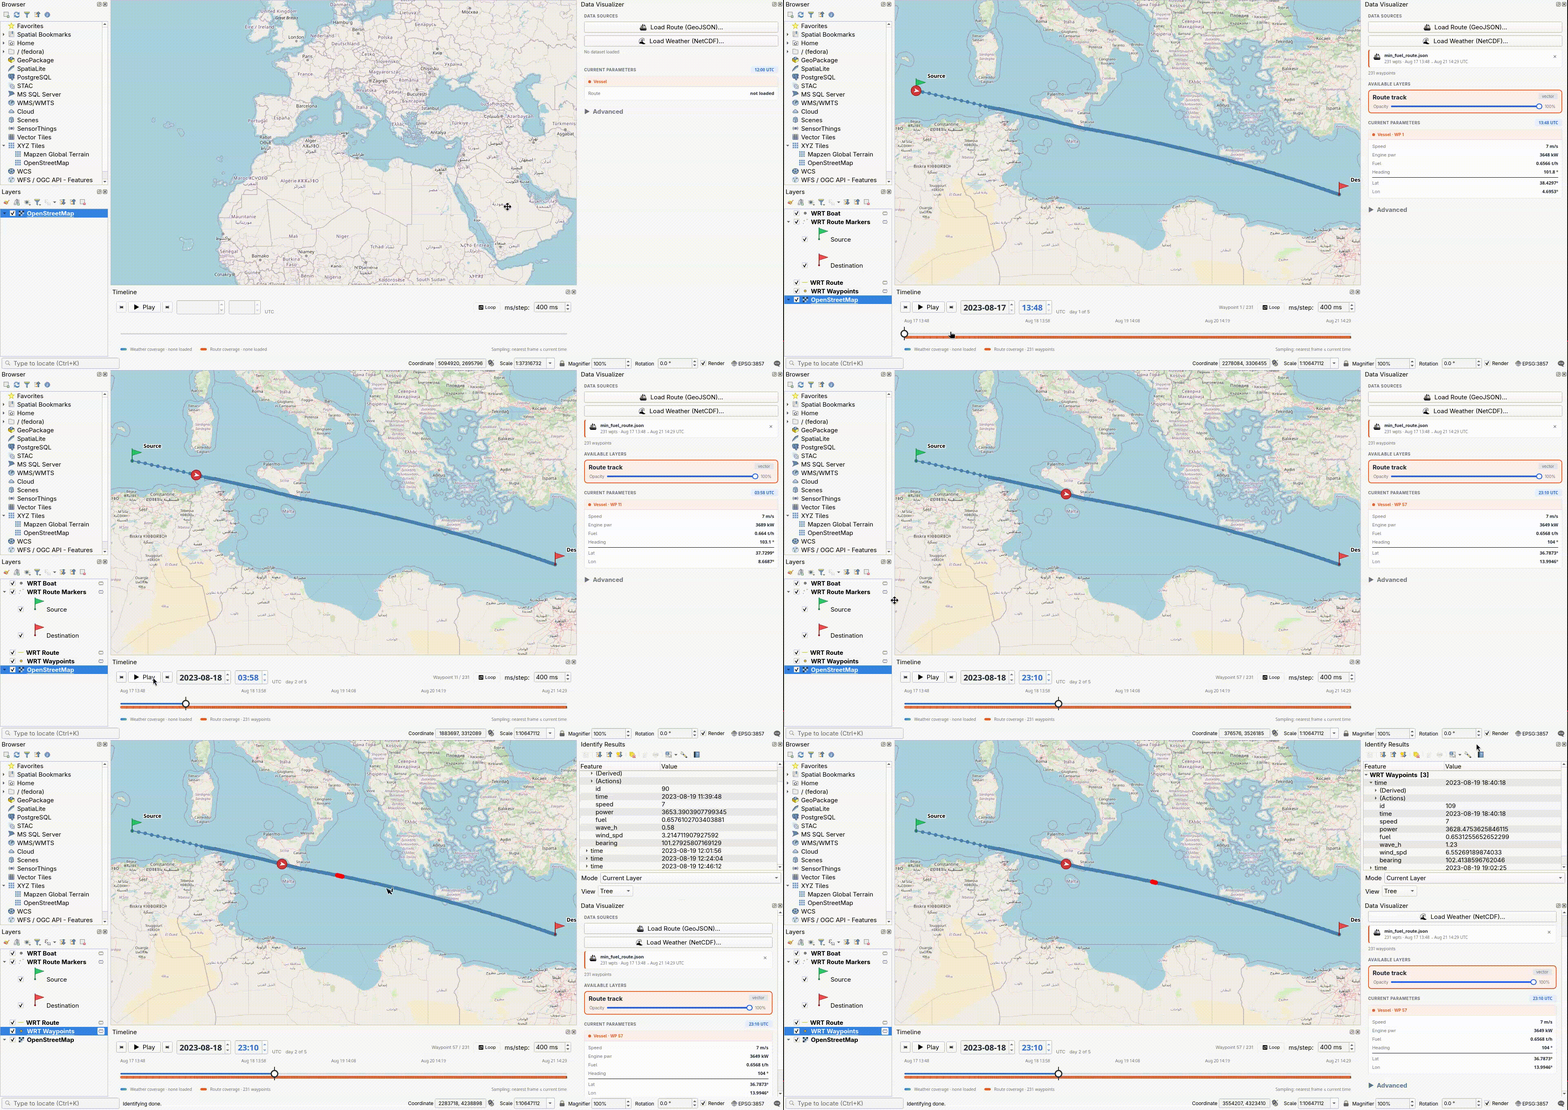
The route can be explored spatially while still having access to the underlying information associated with the route.
Going Deeper into the Geospatial World
One of the most rewarding parts of this project was realizing how much there is behind what appears to be a simple map. Before GSoC, I had worked with QGIS in UAV and spatial analysis workflows. However, developing a plugin gave me a much deeper understanding of the geospatial software ecosystem. I encountered technologies and concepts including:
- PyQGIS
- GDAL
- MDAL
- NetCDF
- GeoJSON
- GeoTIFF
- Raster and vector layers
- Coordinate systems and transformations
- Multidimensional scientific datasets
- QGIS rendering and layer management
What initially looked like a visualization task often involved several layers of geospatial processing underneath. This was one of the biggest technical learning experiences of the project.
Designing for the User Journey
The biggest change in my thinking throughout GSoC was moving from feature-oriented development to user-oriented development. Instead of asking “What feature should I implement next?”, I increasingly found myself asking “What is the user trying to accomplish, and what is currently making that difficult?”. This influenced everything from the organization of the wizard to validation, map interactions, algorithm configuration, and visualization. The plugin is ultimately not just a collection of QGIS features, it is an attempt to provide a smoother journey through the Weather Routing Tool.
The Result
At the end of the GSoC coding period, the project has reached the goals defined within its scope. The WRT-QGIS plugin now provides the foundation for a more intuitive interaction with Weather Routing Tool through QGIS, with the configuration workflow and route visualization forming the core of the user experience. The final result is less about adding another interface to WRT and more about changing how users experience the tool.
PR References
- https://github.com/52North/WRT-QGIS/pull/1
- https://github.com/52North/WRT-QGIS/pull/2
- https://github.com/52North/WRT-QGIS/pull/3
- https://github.com/52North/WRT-QGIS/pull/4
- https://github.com/52North/WRT-QGIS/pull/5
- https://github.com/52North/WRT-QGIS/pull/7
- https://github.com/52North/WRT-QGIS/pull/8
Issues Created
Future Scope
Although the GSoC coding period is coming to an end, there are several directions in which the plugin can continue to evolve. One of the major next steps is running the Weather Routing Tool directly from within QGIS. Currently, the plugin focuses on simplifying configuration and bringing visualization into the GIS workflow. Integrating WRT execution would take this one step further and create a more complete workflow: Configure → Visualize → Run WRT → Analyze Results (everything inside the GIS environment). This would remove another step from the user’s journey and allow a complete routing workflow to happen without leaving QGIS. Other future directions include further usability improvements, testing, documentation, and incorporating feedback from users and the 52°North community.
Conclusion
When I started GSoC, I expected to learn how to build a QGIS plugin. I ended up learning much more. I learned about geospatial data, QGIS internals, GDAL, MDAL, scientific datasets, UI design, user studies, debugging, software architecture, and most importantly, how users actually interact with software. The project also taught me that building a good tool is not simply about making something technically possible. It is about making that capability understandable, accessible, and useful. I am incredibly grateful to my mentors, Martin Pontius and Katharina Demmich, for their guidance, feedback, and patience throughout the project. A huge thank you to 52°North and the Google Summer of Code community for giving me the opportunity to work on an open-source project, learn from experienced developers, and contribute to software that solves a real-world problem. This has been an incredible experience, and I look forward to continuing the journey with 52°North beyond GSoC.
Thank you for reading!
Shashaank Srivastava
These developments took place in connection with the TwinShip project.
 This work has been co-funded by the European Union’s Horizon Europe programme under grant agreement No. 101192583
*AI supported
Leave a Reply