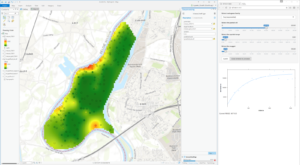
ArcGIS is the central tool to handle and derive geoinformation in many applications. However, the standard kriging capabilities only include a few covariance functions and hide the estimation and fit quality of the semivariogram to a large degree. R is less appealing for working with maps, but features a variety of statistical, i.e. geostatistical, extensions. In this showcase, we exploit the semivariogram modeling and kriging capabilities of the gstat R package. In order to give the user visual control over the estimation procedure and the model selection, we use the Shiny framework to realize an interactive graphical user-interface for the semivariogram fitting step. This tool hides the entire R implementation from the user, but delivers a good deal of the geostatistical power to perform kriging.more >
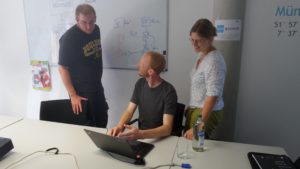
Follow-up Workshop: GLUES SDI Team and COMTESS project develop Shiny app
52°North recently organized a follow-up workshop between members of the Sustainable Coastal Land Management: Trade-offs in Ecosystem Services (COMTESS) project and members of the GLUES Scientific Data Infrastructure (SDI) team.more >
enviroCar Processing Tools
Last semester, the Institute for Geoinformatics offered a course “Web-based Spatio-temporal Analysis of Floating Car Data”. It focused on developing tools to analyze enviroCar data. Sixteen students got together in small groups and successfully developed several analysis tools. One group created an R Shiny-based Web application for analyzing anomalies in the enviroCar data. Another group implemented an R package to assign the enviroCar data to street segments in order to calculate aggregates for the street segments, e.g. average speed. A third group evaluated an approach for estimating noise emissions using regression models and implemented a simple online tool for noise estimation. Add your own GeoJSON track!
These are only a few examples of the work done. But they nicely demonstrate further ways of analyzing enviroCar data to answer various questions from different application domains.
Advanced time series analysis on the web with R
Today we want to present one of the latest open source projects that brings together expertise from the Geostatistics and Sensor Web communities. The new web application sensorweby successfully integrates the 52°North JavaScript SOS Client with the analytical powers of R and creates a new and completely open source software solution to create advanced analysis and visualizations of time series data.
Find out more about the project on GitHub or Open HUB and try out the examples pages on the Geostaticstics Community Demo Server and 52°North contributor IRCEL-CELINE.
more >