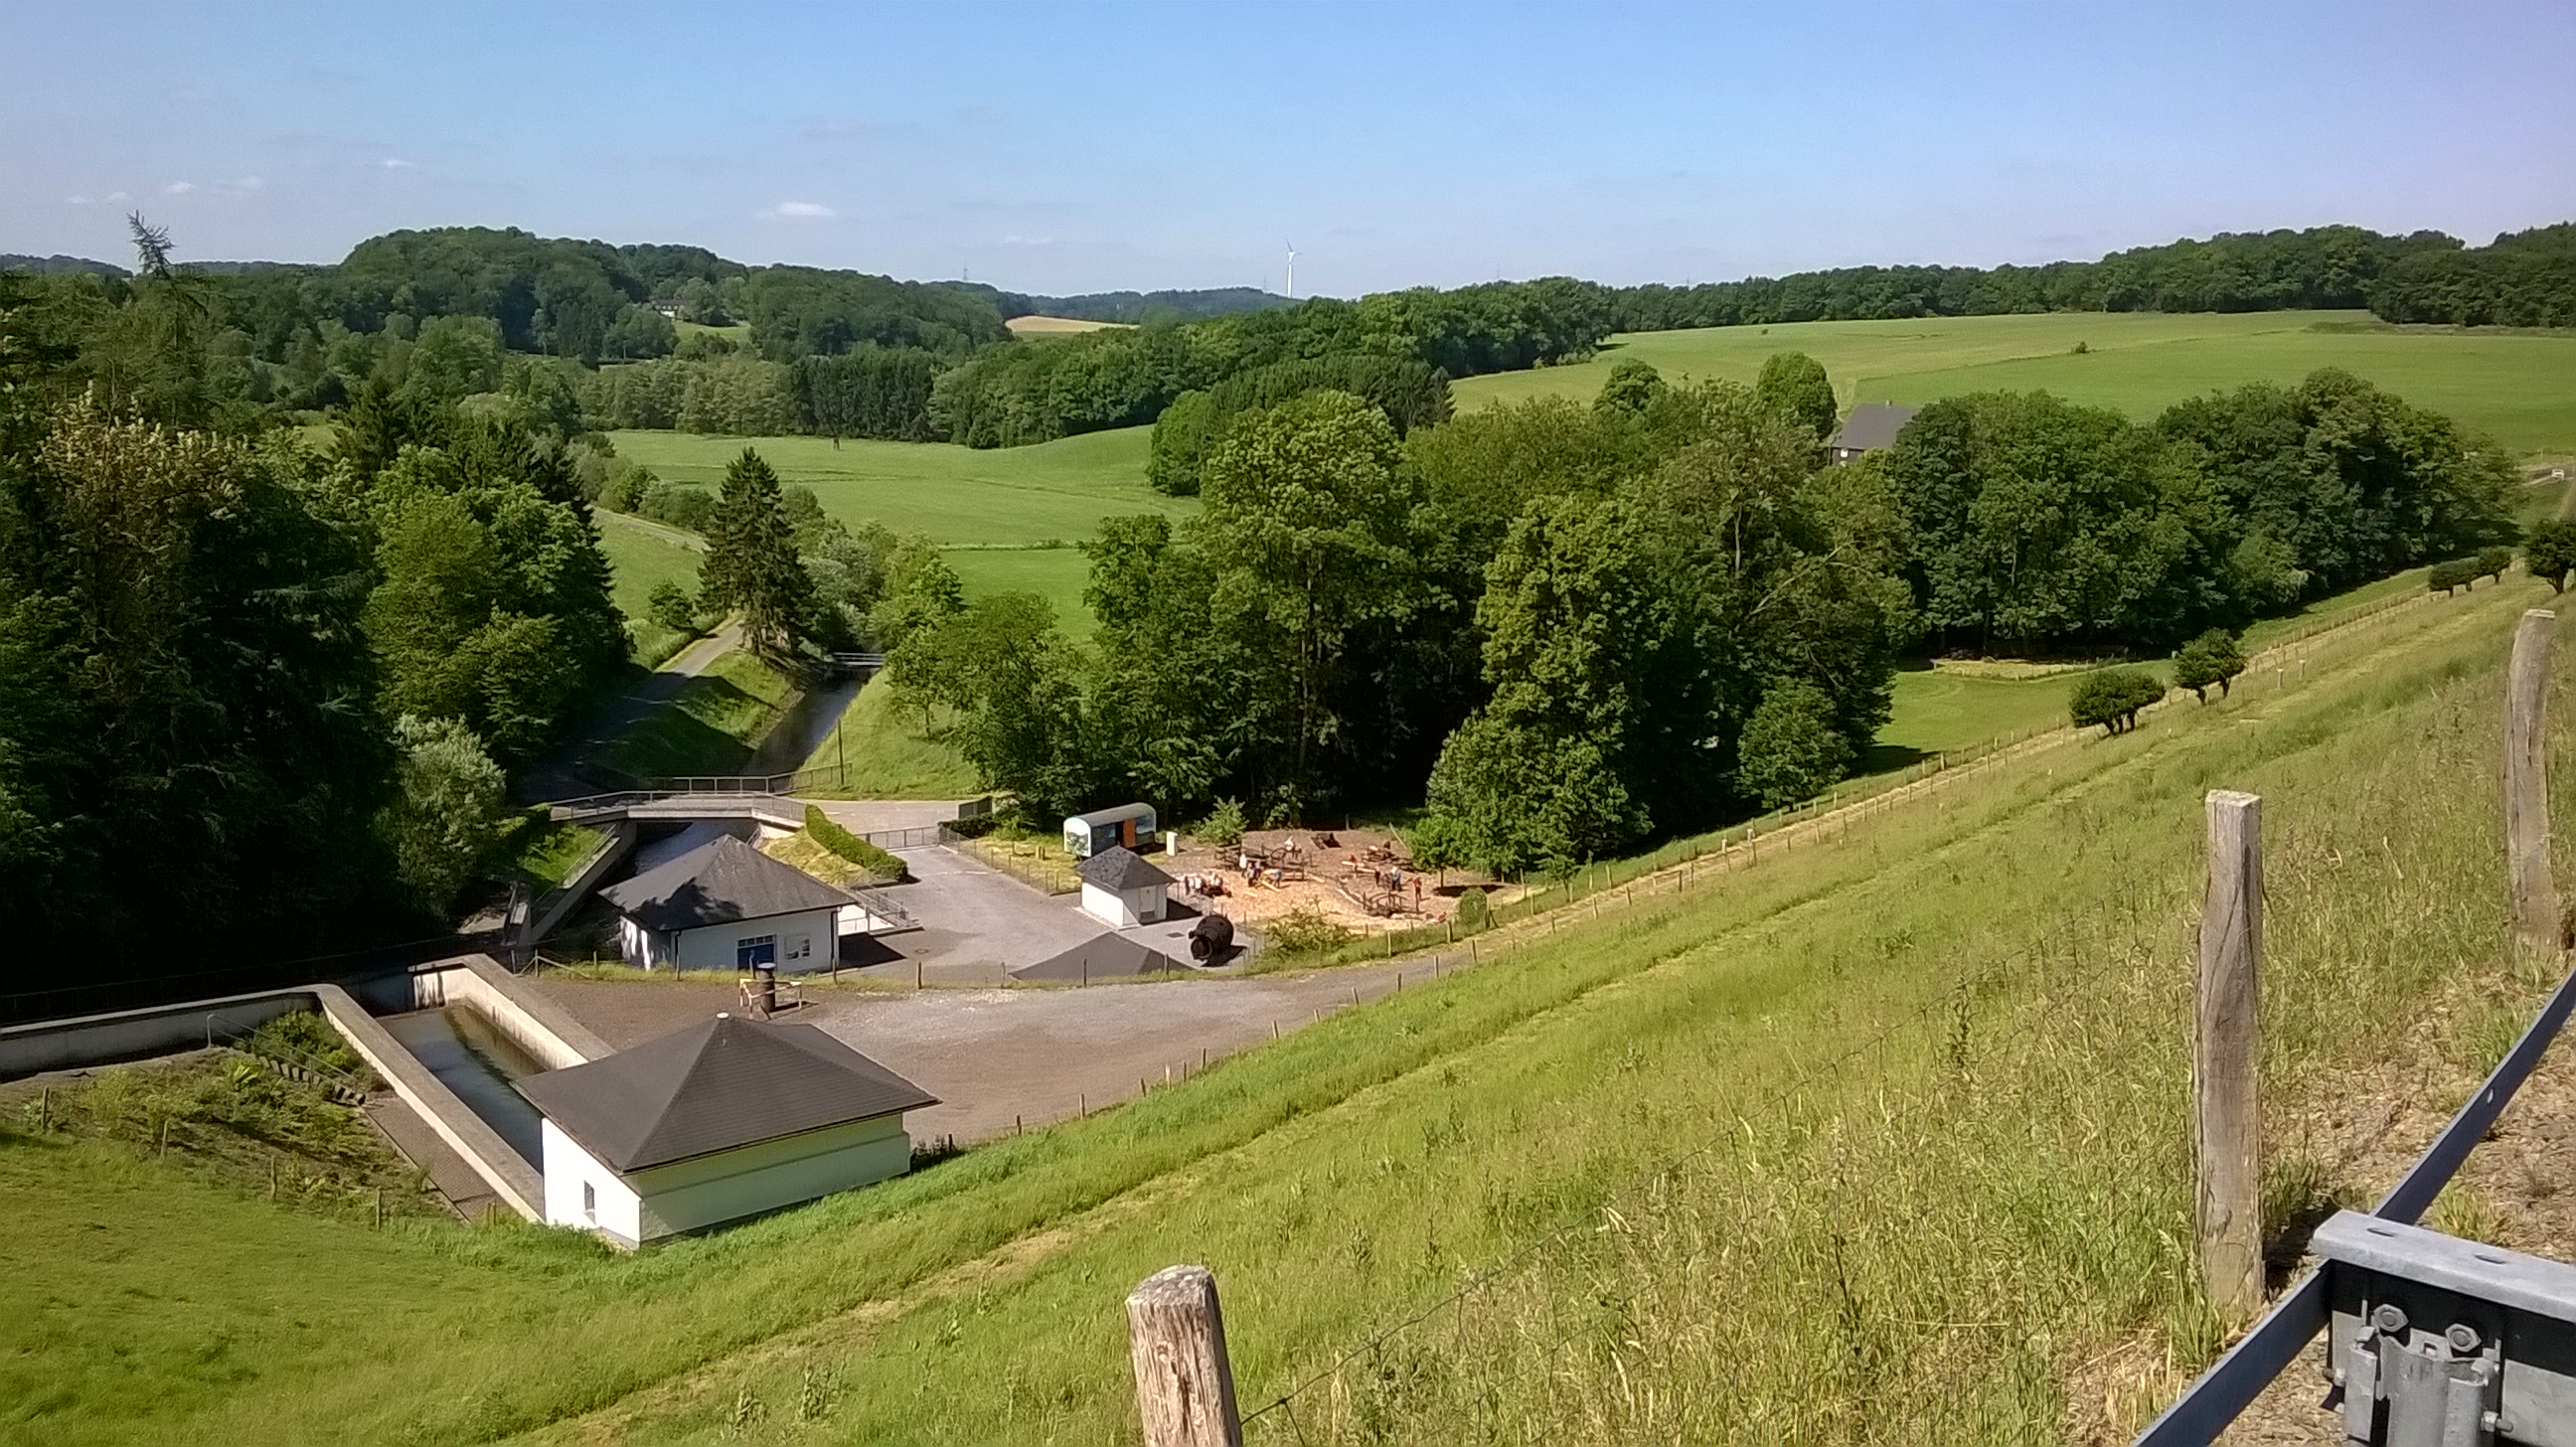
On Monday, June 8th, Daniel Nüst, Simon Jirka and Christoph Stasch participated in the TaMIS (dam measuring information system) project kick-off meeting at the Bever Valley Dam (Bever-Talsperre) in North Rhine Westfalia. It also included a guided tour of the dam’s control corridor and its measurement technology.more >
enviroCar – Social Driving Stats
One of the Google Summer of Code 2015 projects offered by 52°North is “Social Driving Stats”. It is a sub project related to 52°North’s enviroCar project. I will be working on this project under the mentoring of Dr.Christoph Stasch and Matthes Rieke. enviroCar offers a citizen science platform for collecting, analyzing, sharing and discussing car sensor data. Sharing specific tracks or statistics is currently not possible with enviroCar. The Social Driving Stats project aims to enhance the enviroCar with sharing facilities and social media links by implementing a REST interface for creating and providing track visualizations and statistics. Furthermore, enviroCar should be linked to social networks, such as Google Plus, Facebook or Twitter. Therefore, this project will utilize the APIs of these platforms and integrate them within the user profile pages of enviroCar.
SOS Importer 0.4.0 Development Version Released
The Sensor Web community announces a new version of the SOS (Sensor Observation Service) Importer . It is a tool for importing observations from CSV (Character Separated Values) files to a SOS instance. An eight step wizard guides a user through the often cumbersome process of data transformation.
52°North JavaScript SOS Client 1.0 – official release
We are proud to release the first version of the JavaScript SOS client! This lightweight browser client enables users to display time series and metadata of one or more Sensor Observation Services.
A responsive design supports a broad range of devices from mobile devices to desktop screens. Based on HTML and JavaScript, the client uses the following main libraries and frameworks:
- JQuery (extended JavaScript functionalities),
- Bootstrap (design),
- Leaflet (to select station by a map),
- Flot (to display the time series).
- « Previous Page
- 1
- 2
- 3
- 4
- 5
- 6
- …
- 12
- Next Page »